Chicago, IL and Manhattan, NY are two of the most iconic cities in the United States, each offering a unique living experience. This comparative analysis delves into aspects of crime/safety, weather, cost of living, education, work and economy, infrastructure, industries and occupations, biggest employers, real-estate, neighborhoods, transportation, city and state taxes, culture and food, sports teams, geographical conditions, and health care. Understanding these aspects can aid in an informed decision for those contemplating relocation or visitors planning a trip.
Crime rates in Chicago and Manhattan provide contrasting scenarios. Crime rates in Chicago are generally higher, with a crime rate that exceeds the national average. However, efforts to reduce crime in the city have resulted in a decline in recent years. Manhattan, on the other hand, has a relatively lower crime rate compared to national averages and many major cities, aided by continuing police efforts towards crime reduction.
Cost of Living
Overall, the cost of living in Manhattan is significantly higher than it is in Chicago. Living in New York City, specifically Manhattan, is known for being extremely expensive, from rent to groceries to going out. Chicago is more affordable, but still higher than the national average, making it a more feasible choice for some people.
Income Tax
Illinois, where Chicago is located, has a flat state income tax rate of 4.95%. New York State has a progressive income tax rate ranging from 4% to 8.82%, depending on income level. In addition to state taxes, New York City also imposes a municipal tax ranging from 3.078% to 3.876%.
Property Tax
Property tax rates in Illinois are among the highest in the U.S., which significantly impacts Chicago homeowners. In contrast, New York City has one of the lowest property tax rates in the country, but this is offset by Manhattan's incredibly high property values.
Sales Tax
As for sales tax, Chicago's combined city and state sales tax rate is currently at 10.25%, which is one of the highest in the nation. New York State's sales tax is only 4%, but New York City collects an additional 4.875% making the combined tax for Manhattan 8.875%.
Income
Type
Chicago
Manhattan
Estimated median household income
$66,576
$84,435
Estimated per capita income
$43,217
$76,589
Cost of living index (U.S. average is 100)
104.8
185.3
If you make $50,000 in Chicago, you will have to make $88,406 in Manhattan to maintain the same standard of living.
Geographical Conditions
Geographically, Chicago enjoys an extensive lakefront along Lake Michigan. In contrast, Manhattan is an island bordered by the Hudson, East, and Harlem rivers with a diverse range of urban landscapes from Central Park to Times Square.
Geographical information
Type
Chicago
Manhattan
Land area
227.1 sq. miles
23 sq. miles
Population density
11,872 people per sq. mile
70,629 people per sq. mile
Relative area comparison
Chicago, IL Manhattan, NY
Education
Both cities boast esteemed educational institutions. Chicago is home to prestigious universities like the University of Chicago and Northwestern University. Manhattan hosts Columbia University and New York University, among others. Both cities also have extensive public school systems, with NYC's being the largest in the country.
Manhattan's economy, as part of the broader NYC, is driven by finance, media, art, fashion, technology, and healthcare sectors while Chicago's economy is diverse with sectors like finance, manufacturing, publishing, and food processing playing significant roles. Both cities offer a wealth of job opportunities, but roles and salaries greatly vary between two.
Biggest Employers
The largest employers in Chicago include government entities, the healthcare sector, and universities. In Manhattan, finance industry corporations like JPMorgan Chase & Co and Citigroup, along with other large employers like the City of New York and Columbia University, dominate the jobs landscape.
In Chicago (Cook County), 74.0% voted for Democrats and 24.6% for Republicans in 2012 Presidential Election. In Manhattan (New York County), 83.9% voted for Democrats and 14.9% for Republicans.
Elections
Type
Democrats
Republicans
Other
Year
Chicago
Manhattan
Chicago
Manhattan
Chicago
Manhattan
2020
74.6%
86.5%
24.1%
12.2%
1.3%
1.2%
2016
74.4%
86.7%
20.9%
9.7%
4.7%
3.6%
2012
74.0%
83.9%
24.6%
14.9%
1.4%
1.2%
2008
76.4%
86.1%
22.9%
13.5%
0.7%
0.3%
2004
70.3%
82.3%
29.2%
16.8%
0.6%
0.9%
2000
69.0%
80.0%
28.8%
14.5%
2.3%
5.5%
1996
66.8%
80.0%
26.7%
13.8%
6.5%
6.3%
Breakdown of population affiliated with a religious congregation
Type
Adherents
Congregations
Religion
Chicago
Manhattan
Chicago
Manhattan
CATHOLIC CHURCH
37.5%
20.4%
11.1%
12.6%
MUSLIM ESTIMATE
3.9%
2.7%
1.8%
2.4%
EVANGELICAL LUTHERAN CHURCH IN AMERICA
1.0%
0.3%
4.3%
2.0%
SOUTHERN BAPTIST CONVENTION
1.0%
0.2%
5.4%
2.9%
LUTHERAN CHURCH
0.9%
0.0%
3.6%
0.6%
AMERICAN BAPTIST CHURCHES IN THE USA
0.4%
1.6%
1.6%
4.7%
EPISCOPAL CHURCH
0.4%
1.7%
1.8%
5.3%
SEVENTH DAY ADVENTIST CHURCH
0.4%
0.3%
1.9%
2.4%
REFORMED CHURCH IN AMERICA
0.1%
0.6%
0.4%
1.2%
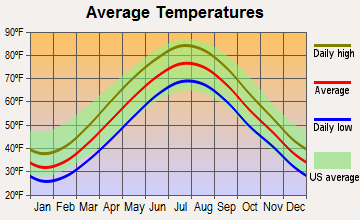
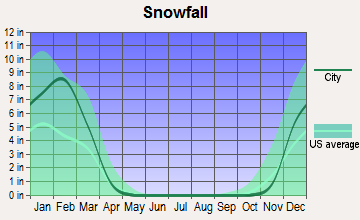
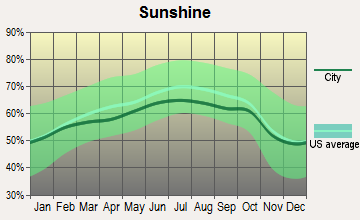
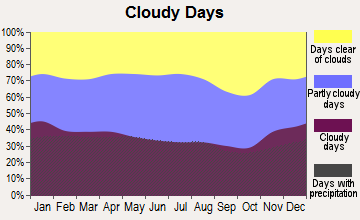
Weather
Chicago’s climate is classified as humid continental, characterized by four distinct seasons. Winters can be extremely cold and windy – thus, its nickname "The Windy City". Summers, alternatively, are hot and humid. Manhattan, part of New York City, also experiences four seasons but the city’s coastal location often leads to milder winters and its urban landscape can contribute to warmer summers.
Weather and climate
Type
Chicago
Manhattan
Temperature - Average
50.3°F
54.6°F
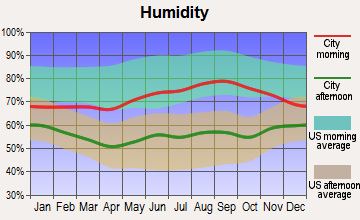
Humidity - Average morning or afternoon humidity
75.6%
67.4%
Humidity - Differences between morning and afternoon humidity
31%
30%
Humidity - Maximum monthly morning or afternoon humidity
85%
77%
Humidity - Minimum monthly morning or afternoon humidity
54%
47%
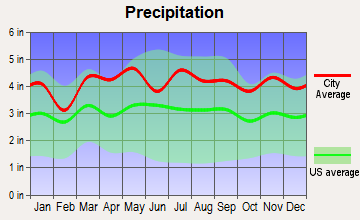
Precipitation - Yearly average
37.8 in
49.6 in
Snowfall - Yearly average
77.6 in
57.4 in
Clouds - Number of days clear of clouds
14%
17.8%
Sunshine amount - Average
56.8%
60.2%
Sunshine amount - Differences during a year
33%
20%
Sunshine amount - Maximum monthly
68%
64%
Sunshine amount - Minimum monthly
35%
44%
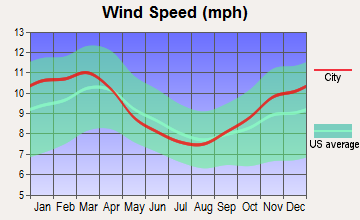
Wind speed - Average
10.7 mph
6.7 mph
Average climate in Chicago, Illinois
Average climate in Manhattan, New York
Air pollution
Type
AQI
CO
NO2
OZONE
PB
PM10
PM25
SO2
Year
Chicago
Manhattan
Chicago
Manhattan
Chicago
Manhattan
Chicago
Manhattan
Chicago
Manhattan
Chicago
Manhattan
Chicago
Manhattan
Chicago
Manhattan
2018
97
94
0.26
0.29
14.3
17.3
26.2
23.9
N/A
N/A
23.6
N/A
9.3
7.9
1.7
0.5
2017
95
97
0.25
0.16
14.3
17.4
26.4
24.0
N/A
N/A
25.1
N/A
8.7
7.7
1.4
0.4
2016
95
94
0.21
0.28
14.9
18.1
26.5
24.2
N/A
N/A
17.3
N/A
9.1
7.7
0.8
0.6
2015
92
100
0.51
0.36
15.0
18.9
25.4
23.0
N/A
N/A
23.3
N/A
10.5
8.6
0.9
1.0
2014
101
95
0.45
0.40
18.0
19.1
25.1
22.3
N/A
N/A
28.9
N/A
10.7
8.3
1.3
1.1
2013
100
97
0.37
0.43
18.3
19.5
23.8
22.6
N/A
N/A
30.3
N/A
11.1
9.0
1.0
1.1
2012
112
99
0.36
0.46
18.8
18.6
25.7
23.4
N/A
N/A
31.3
N/A
12.1
9.3
1.7
1.7
2011
101
108
0.38
0.46
18.6
20.7
24.8
22.2
N/A
N/A
21.9
N/A
12.8
10.9
2.4
2.7
2010
103
113
0.37
0.45
20.4
19.3
25.4
23.3
N/A
N/A
22.2
N/A
12.9
10.4
1.4
2.7
2009
106
104
0.29
0.51
20.0
21.9
22.4
18.8
0.025
N/A
20.1
N/A
12.9
10.7
1.4
3.8
2008
108
110
0.32
0.49
22.8
23.0
22.8
19.8
0.026
0.013
22.7
N/A
12.5
12.3
1.8
4.6
2007
125
121
0.34
0.56
23.6
24.4
23.9
19.4
0.027
0.016
25.9
N/A
13.1
13.1
2.2
5.5
2006
95
116
0.31
0.64
23.0
24.6
21.1
18.9
0.029
0.018
22.0
N/A
N/A
12.9
2.6
6.5
2005
110
112
0.55
0.77
23.5
26.7
23.3
18.4
0.027
N/A
26.2
N/A
N/A
N/A
3.3
8.2
2004
85
108
0.83
0.77
23.9
26.7
20.3
17.3
0.032
0.030
23.4
N/A
N/A
N/A
4.1
8.0
2003
99
107
0.69
0.83
25.1
27.8
20.0
17.5
0.030
0.024
23.3
26.9
N/A
N/A
3.1
8.2
2002
114
122
0.83
0.78
26.5
27.9
20.8
18.7
0.029
0.008
24.4
25.9
N/A
N/A
3.3
7.3
2001
107
123
0.83
0.79
27.3
29.4
19.2
19.4
0.031
0.020
28.5
25.0
N/A
N/A
4.3
8.7
2000
104
115
0.88
0.90
24.8
30.2
17.6
15.0
0.046
0.022
N/A
22.2
N/A
N/A
4.2
8.4
Natural disasters
Type
Chicago
Manhattan
Tornado activity compared to U.S. average
145.8%
59.1%
Earthquake activity compared to U.S. average
136.9%
31.1%
Natural disasters compared to U.S. average
20%
18%
Transportation
Both Chicago and Manhattan have extensive public transit systems. The Chicago Transit Authority serves city with buses and 'L' train system while Manhattan is served by the New York City Subway and bus system. Both cities are also very walkable and have bike-sharing programs.
Transport
Type
Chicago
Manhattan
Amtrak stations
1
0
Amtrak stations nearby
3
3
FAA registered aircraft
1
2
FAA registered aircraft manufacturers and dealers
12
0
Means of transportation to work
Type
Chicago
Manhattan
Bicycle
1.6%
0.9%
Bus
8%
10.1%
Carpooled
8.3%
3.4%
Car alone
62.3%
7.6%
Railroad
0.2%
1.1%
Streetcar
6.8%
0.1%
Subway
3.5%
43.6%
Taxicab
0.8%
4.7%
Walked
5.9%
21.9%
Average travel time to work
Type
Chicago
Manhattan
Average
36.9 min
30.3 min
Real Estate
Real Estate market in Manhattan is renowned for its expensive nature, driven by its densely populated nature and the desire for space. On the other hand, Chicago’s real estate market is more affordable and diverse, providing options for a wider range of incomes.
Neighborhoods
Both cities offer diverse neighborhoods, each with its distinct vibe and attractions. In Chicago, Lincoln Park, Hyde Park, and Lakeview are among popular choices. In Manhattan, neighborhoods like Upper East Side, Greenwich Village, and Soho are sought after for their unique qualities.
Houses and residents
Type
Chicago
Manhattan
Houses
1,272,191
798,144
Average household size (people)
2.5
2
Houses occupied
1,139,537 (89.6%)
738,644 (92.5%)
Houses occupied by owners
530,977 (46.6%)
148,695 (20.1%)
Houses occupied by renters
608,560 (53.4%)
589,949 (79.9%)
Median rent asked for vacant for-rent units
$1,546
$1,690
Median price asked for vacant for-sale houses and condos
$355,671
$3,393,315
Estimated median house or condo value
$297,300
$940,900
Median number of rooms in apartments
4
3.2
Median number of rooms in houses and condos
5.8
4
Renting percentage
55.1%
77.2%
Housing density (houses/condos per square mile)
5,601.1
34,757
Household income disparities
48.4%
47.8%
Housing units without a mortgage
6,624 (1.9%)
1,104 (40.3%)
Housing units with both a second mortgage and home equity loan
17,661 (5.1%)
13 (0.5%)
Housing units with a mortgage
339,523 (98.1%)
1,636 (59.7%)
Housing units with a home equity loan
808 (0.2%)
140 (5.1%)
Housing units with a second mortgage
25,416 (7.3%)
140 (5.1%)
Housing units lacking complete kitchen facilities
2.5%
2%
Housing units lacking complete plumbing facilities
Self-employed workers in own not incorporated business
67,964
69,517
State government workers
41,316
15,544
Unpaid family workers
4,164
1,861
Industries and Occupations
In Chicago, the largest industries include healthcare, education, and professional and business services. In Manhattan, the financial sector is prominence, alongside other professional services like law, advertising, and media.
Both cities have top-tier healthcare systems. Chicago is home to highly-ranked hospitals like Northwestern Memorial. Manhattan, amid New York City, hosts world-renowned institutions like New York-Presbyterian and Mt. Sinai.
Health (county statistics)
Type
Chicago
Manhattan
General health status score of residents in this county from 1 (poor) to 5 (excellent)
Chicago's infrastructure includes notable features like the 'L' train and vast sidewalk grids, while Manhattan is known for its high-rise buildings, subway system, and iconic bridges. Both cities continually invest in infrastructure updates and maintain comprehensive public utilities.
Infrastructure
Type
Chicago
Manhattan
TV stations
22
30
Culture and Food
Both cities boast vibrant cultural scenes. Chicago is famed for its jazz music, comedy clubs, and deep-dish pizza. Manhattan offers Broadway shows, diverse cuisine that reflects its melting pot of cultures, and iconic culinary institutions.
Sports Teams
Chicago is home to several professional sports franchises, including the Cubs (baseball), Bulls (basketball), and Bears (football). Meanwhile, Manhattan hosts the New York Knicks (basketball) and is near to the home venues of the Yankees (baseball) and the Giants (football).


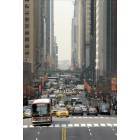


 Chicago, IL
 Manhattan, NY