This comparative piece aims to help navigate the differences and similarities between Columbus, OH and Fort Wayne, IN targeting both potential re-locators and tourists. Each city represents unique attributes in terms of crime and safety, weather conditions, cost of living, education systems, work and economic outlook, infrastructural development, industries and occupations, significant employers, real estate market, neighborhood profiles, transportation systems, sales, income and property tax rates, culinary culture, sports teams, geographical conditions, and health care quality.
Distance between
Columbus, OH and
Fort Wayne, IN : 135.0 miles
Columbus's population is larger by 241%. Its population has grown by 195,058 people (27.4%) since 2000. The population of Fort Wayne has grown by 60,247 people (29.3%) during that time.
Columbus has a somewhat higher crime rate compared to the national average, which may be concerning for prospective residents and visitors. Conversely, Fort Wayne, IN, has a slightly lower crime rate offering a safer environment comparatively. However, specific neighborhoods in both cities have better crime statistics.
City-data.com crime index counts serious crimes and violent crime more heavily. It adjusts for the number of visitors and daily workers commuting into cities. (higher means more crime, U.S. average = 301.1)
City-data.com crime index counts serious crimes and violent crime more heavily. It adjusts for the number of visitors and daily workers commuting into cities. (higher means more crime, U.S. average = 301.1)
Sex Offenders
According to our data, there are 1,506 registered sex offenders living in Columbus and 18 registered sex offenders living in . The ratio of residents to sex offenders in Columbus is 573 to 1; the ratio in Fort Wayne is 14,519 to 1. The number of registered sex offenders compared to the number of residents is much larger in Columbus than that in Fort Wayne.
Cost of Living
Living costs in both cities are lower than the national average. However, Fort Wayne offers a slightly lower cost of living than Columbus, especially in categories like housing and utilities, making it a more affordable option.
Income Tax
Both cities are subject to state income tax, with Ohio having a progressive tax rate scaling with income, and Indiana maintaining a flat 3.23% tax rate.
Property Tax
Ohio's average property tax rate is higher compared to that in Indiana. Thus, property owners in Columbus generally pay more property tax than those in Fort Wayne.
Sales Tax
Ohio's state sales tax (which includes Columbus) stands at 5.75%, while Indiana's (including Fort Wayne) is slightly higher at 7%. Various city and county taxes may also apply.
Income
Type
Columbus
Fort Wayne
Estimated median household income
$58,202
$54,737
Estimated per capita income
$32,392
$29,282
Cost of living index (U.S. average is 100)
96.1
82.8
If you make $50,000 in Fort Wayne, you will have to make $58,031 in Columbus to maintain the same standard of living.
Geographical Conditions
Columbus is centrally located in Ohio with a flat terrain, while Fort Wayne is situated in northeastern Indiana with a largely flat landscape interrupted by some small hills, lakes, and rivers.
Columbus is home to the renowned Ohio State University, providing excellent options for higher education. However, Fort Wayne's education system also impresses with its diversity of public, private, and charter schools, as well as universities, making both cities competitive in terms of education.
Both cities present thriving economic prospects but differ in terms of dominant industries. Columbus's economy heavily relies on education, government, and insurance sectors, while Fort Wayne is prominent in manufacturing.
Biggest Employers
Columbus's largest employers include Ohio State University and OhioHealth. In contrast, Fort Wayne's biggest employment sources are Parkview Health System and Lutheran Health Network.
There were 913 building permits issued in Columbus in 2012 (246 more than in 2011) compared to 8 building permits issued in Fort Wayne in 2012 (8 more than in 2011).
In Columbus (Franklin County), 60.8% voted for Democrats and 37.9% for Republicans in 2012 Presidential Election. In Fort Wayne (Allen County), 40.9% voted for Democrats and 57.6% for Republicans.
Elections
Type
Democrats
Republicans
Other
Year
Columbus
Fort Wayne
Columbus
Fort Wayne
Columbus
Fort Wayne
2020
64.7%
43.3%
33.4%
54.5%
1.9%
2.2%
2016
59.8%
37.3%
33.9%
56.6%
6.2%
6.1%
2012
60.8%
40.9%
37.9%
57.6%
1.3%
1.5%
2008
59.8%
47.5%
39.0%
51.8%
1.2%
0.7%
2004
54.5%
36.1%
45.2%
63.4%
0.3%
0.6%
2000
48.9%
36.4%
47.9%
61.6%
3.2%
2.0%
1996
48.1%
37.8%
44.5%
54.1%
7.3%
8.0%
Breakdown of population affiliated with a religious congregation
Type
Adherents
Congregations
Religion
Columbus
Fort Wayne
Columbus
Fort Wayne
CATHOLIC CHURCH
13.2%
16.0%
5.6%
5.6%
EVANGELICAL LUTHERAN CHURCH IN AMERICA
1.6%
2.3%
3.7%
3.5%
SOUTHERN BAPTIST CONVENTION
1.6%
1.2%
6.8%
3.8%
MUSLIM ESTIMATE
1.3%
0.3%
1.9%
0.5%
VINEYARD USA
1.3%
0.0%
1.2%
0.0%
AMERICAN BAPTIST CHURCHES IN THE USA
1.0%
1.1%
3.3%
2.0%
EPISCOPAL CHURCH
0.4%
0.2%
1.3%
0.8%
SEVENTH DAY ADVENTIST CHURCH
0.4%
0.2%
2.0%
0.8%
LUTHERAN CHURCH
0.2%
6.8%
1.0%
8.9%
Weather
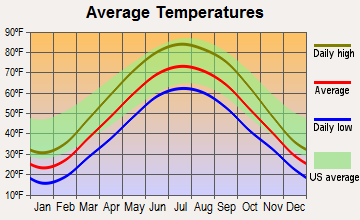
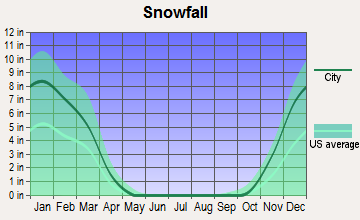
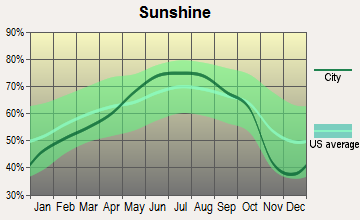
The climates in both cities are quite similar. They experience all four seasons with hot, humid summers and cold, snowy winters. Columbus is slightly warmer and receives less snow than Fort Wayne, which might be suitable for those less inclined toward colder climates.
Weather and climate
Type
Columbus
Fort Wayne
Temperature - Average
52.8°F
49.9°F
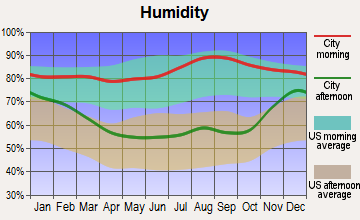
Humidity - Average morning or afternoon humidity
74.8%
77.5%
Humidity - Differences between morning and afternoon humidity
34%
33%
Humidity - Maximum monthly morning or afternoon humidity
86%
87%
Humidity - Minimum monthly morning or afternoon humidity
52%
54%
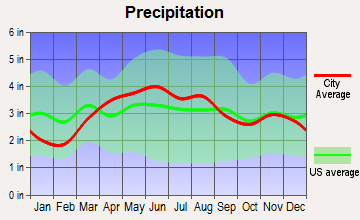
Precipitation - Yearly average
39.3 in
36.5 in
Snowfall - Yearly average
56.6 in
64.8 in
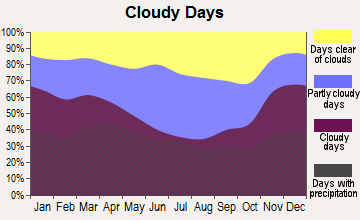
Clouds - Number of days clear of clouds
12%
13.1%
Sunshine amount - Average
49.7%
65.2%
Sunshine amount - Differences during a year
27%
40%
Sunshine amount - Maximum monthly
55%
76%
Sunshine amount - Minimum monthly
28%
36%
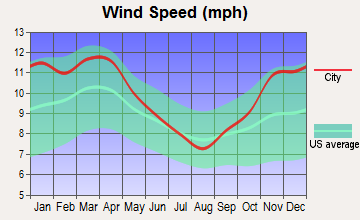
Wind speed - Average
8.2 mph
9.9 mph
Average climate in Columbus, Ohio
Average climate in Fort Wayne, Indiana
Air pollution
Type
AQI
CO
NO2
OZONE
PM10
PM25
SO2
Year
Columbus
Fort Wayne
Columbus
Fort Wayne
Columbus
Columbus
Fort Wayne
Columbus
Columbus
Fort Wayne
Columbus
2018
69
74
0.11
N/A
10.0
N/A
33.8
27.2
N/A
N/A
6.0
8.8
0.0
N/A
2017
68
68
0.16
N/A
9.6
N/A
28.7
28.3
N/A
N/A
5.5
8.2
0.1
N/A
2016
76
78
0.17
N/A
10.6
N/A
28.5
N/A
N/A
N/A
5.6
8.8
0.1
N/A
2015
74
85
0.16
N/A
11.3
N/A
27.0
N/A
N/A
N/A
6.1
10.8
0.1
N/A
2014
82
93
0.20
N/A
11.0
N/A
28.5
N/A
N/A
N/A
7.4
13.1
0.5
N/A
2013
78
74
N/A
0.45
8.9
N/A
29.6
N/A
N/A
N/A
7.8
9.9
0.6
N/A
2012
87
91
N/A
0.64
N/A
N/A
32.9
N/A
N/A
N/A
8.9
13.9
N/A
N/A
2011
89
87
N/A
0.37
N/A
N/A
28.1
N/A
N/A
N/A
8.9
12.2
N/A
N/A
2010
90
98
N/A
0.34
N/A
N/A
30.5
N/A
N/A
N/A
9.1
15.8
N/A
N/A
2009
61
96
N/A
0.62
N/A
N/A
28.7
N/A
N/A
N/A
N/A
16.5
N/A
N/A
2008
65
96
N/A
0.79
N/A
N/A
31.2
N/A
N/A
N/A
N/A
15.7
1.8
N/A
2007
80
103
N/A
0.47
N/A
N/A
30.8
N/A
N/A
N/A
N/A
13.4
2.8
N/A
2006
75
81
N/A
0.61
N/A
N/A
30.0
N/A
23.7
N/A
N/A
11.8
3.3
N/A
2005
87
107
N/A
0.67
N/A
N/A
29.6
N/A
27.5
N/A
N/A
14.4
4.1
N/A
2004
77
75
N/A
0.85
N/A
N/A
27.8
N/A
24.6
N/A
N/A
N/A
4.4
N/A
2003
91
101
N/A
0.70
N/A
N/A
26.4
N/A
23.9
N/A
N/A
12.2
4.1
N/A
2002
93
101
N/A
0.71
N/A
N/A
31.3
N/A
25.7
N/A
N/A
13.2
4.1
N/A
2001
84
65
N/A
0.65
N/A
N/A
29.2
N/A
25.9
N/A
N/A
N/A
3.5
N/A
2000
57
73
N/A
0.83
N/A
N/A
N/A
N/A
23.5
N/A
N/A
N/A
3.7
N/A
Natural disasters
Type
Columbus
Fort Wayne
Tornado activity compared to U.S. average
119.1%
174.8%
Earthquake activity compared to U.S. average
96.1%
101.2%
Natural disasters compared to U.S. average
16%
14%
Transportation
Columbus's public transportation system is well-developed with frequent bus routes and bike shares. Fort Wayne's transportation system is somewhat limited, with most residents relying on personal vehicles for commuting.
Transport
Type
Columbus
Fort Wayne
Amtrak stations
1
0
Amtrak stations nearby
1
0
FAA registered aircraft
415
209
FAA registered aircraft manufacturers and dealers
4
1
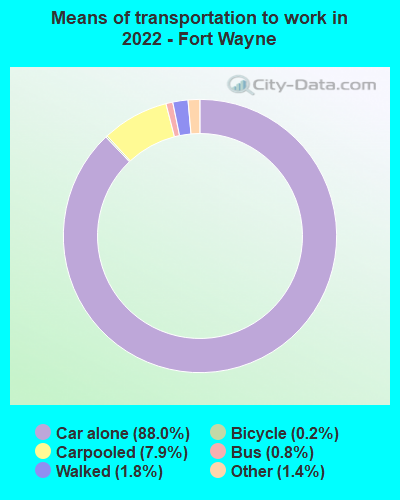
Means of transportation to work
Type
Columbus
Fort Wayne
Bicycle
0.6%
0.4%
Bus
1.6%
0.4%
Carpooled
7.4%
7.4%
Car alone
86.7%
89.6%
Taxicab
0.1%
0%
Walked
2.2%
1.4%
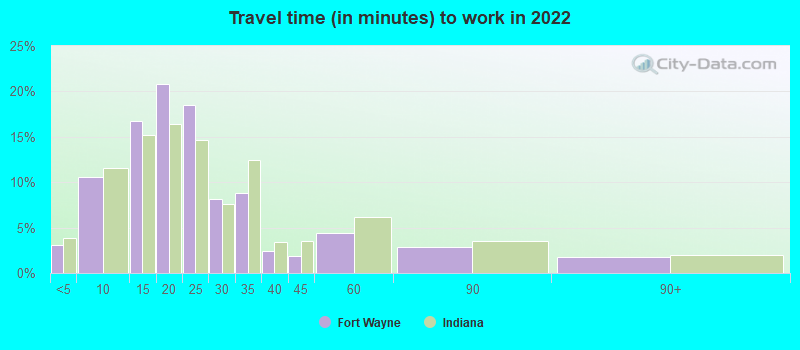
Average travel time to work
Type
Columbus
Fort Wayne
Average
26.1 min
23.9 min
Other means
21.7 min
20.5 min
Public transportation
35.4 min
38.1 min
Private vehicle occupancy
Type
Columbus
Fort Wayne
Average
1.1
1.1
Drove alone
90.7%
91.1%
In 2 person carpool
7.3%
7.4%
In 3 person carpool
1.4%
0.4%
In 4 person carpool
0.5%
0.3%
In 5-6 person carpool
0.1%
0.6%
In 7+ person carpool
0.1%
0.2%
How many people usually rode to work in the car, truck or van.
Real Estate
The housing market in Columbus is more expensive than Fort Wayne due to its larger size and economic growth. However, Fort Wayne homes offer more yard space, a feature cherished by families.
Neighborhoods
Columbus hosts a blend of urban and suburban neighborhoods suitable to various lifestyle choices. Fort Wayne is less diverse but offers quiet, family-oriented neighborhoods with a strong sense of community.
Houses and residents
Type
Columbus
Fort Wayne
Houses
422,120
117,245
Average household size (people)
2.3
2.4
Median year apartment built
1982
1976
Median year house/condo built
1977
1972
Length of stay in the house since moving in
12.6 years
12.2 years
Houses occupied
390,605 (92.5%)
109,640 (93.5%)
Houses occupied by owners
175,427 (44.9%)
68,004 (62%)
Houses occupied by renters
215,178 (55.1%)
41,636 (38%)
Median rent asked for vacant for-rent units
$1,371
$729.05
Median monthly housing costs
$1,110
$844
Median price asked for vacant for-sale houses and condos
$195,022
$135,711
Estimated median house or condo value
$219,200
$155,600
Median numbers of rooms
5
5.9
Median number of rooms in apartments
4.2
4.2
Median number of rooms in houses and condos
6.3
6.8
Median house price - detached houses
$233,452
$167,457
Median house price - in 2-unit structures
$121,729
$66,481
Median house price - in 3-to-4-unit structures
$215,337
$136,033
Median house price - in 5 or more unit structures
$240,711
$154,215
Median house price - mobile homes
$121,578
$54,382
Median house price - Townhouses or other attached units
$218,726
$138,742
Median house price - All housing units
$229,736
$164,476
Median house age
42
48
Renting percentage
53%
36.7%
Housing density (houses/condos per square mile)
2,007.5
1,485
House value disparities
30.2%
31.9%
Household income disparities
42.4%
42.5%
Median household income for houses/condes with a mortgage
$89,058
$72,350
Median household income for apartments without a mortgage
$59,295
$59,128
Housing units without a mortgage
4,290 (3.3%)
811 (1.8%)
Housing units with both a second mortgage and home equity loan
10,651 (8.2%)
3,282 (7.3%)
Housing units with a mortgage
125,487 (96.7%)
43,922 (98.2%)
Housing units with a home equity loan
775 (0.6%)
0 (0%)
Housing units with a second mortgage
13,558 (10.4%)
3,996 (8.9%)
House/condo owner moved in on average (years ago)
10
10
House/condo renter moved in on average (years ago)
1
1
Housing units lacking complete kitchen facilities
1.6%
1%
Housing units lacking complete plumbing facilities
1.3%
0.5%
Housing units in structures
Housing units in structures
Columbus
Fort Wayne
One, detached
45.8%
69.2%
One, attached
9.1%
2.6%
Two
4.0%
2.4%
3 or 4
8.6%
5.3%
5 to 9
11.8%
6.3%
10 to 19
8.6%
5.6%
20 to 49
4.5%
2.8%
50 or more
6.8%
3.7%
Mobile homes
0.8%
2.1%
Boats, RVs, vans, etc.
0.1%
0.0%
Median real estate property taxes paid for housing units
Self-employed workers in own not incorporated business
20,915
6,040
State government workers
31,881
2,352
Unpaid family workers
724
430
Industries and Occupations
Columbus has diversified industries with a focus on education, government, and insurance, offering ample job opportunities in the public sector. Fort Wayne's job market primarily consists of occupations in manufacturing, healthcare, and retail trade.
Based on overall quality, availability, and affordability of health care, both cities are competitive. Columbus houses advanced hospitals like the Ohio State University Wexner Medical Center, while Fort Wayne offers top-rated healthcare facilities like Parkview Regional Medical Center.
Health (county statistics)
Type
Columbus
Fort Wayne
General health status score of residents in this county from 1 (poor) to 5 (excellent)
Columbus offers a more dense and modern infrastructure with significant developments in recent years. In contrast, Fort Wayne showcases historical charm with many well-preserved buildings and structures.
Infrastructure
Type
Columbus
Fort Wayne
Hospitals
47
21
TV stations
14
11
Arenas or stadiums
3
1
Bank branches located here
200
93
Bank institutions located here
25
20
Main business address for public companies
23
3
Drinking water stations with no reported violations in the past
17
1
Drinking water stations with reported violations in the past
HMDA - Conventional home purchase loans - Applications denied
Year
Columbus
Fort Wayne
1999
2,450
1,000
2000
2,376
865
2001
1,897
592
2002
1,483
355
2003
2,087
476
2004
3,216
748
2005
4,275
940
2006
4,662
1,055
2007
2,679
614
2008
1,015
234
2009
555
113
Culture and Food
Columbus boasts a vibrant cultural and culinary scene, featuring diverse food options, festivals, music events, and art galleries. Fort Wayne's culture is more laid-back with a great emphasis on local traditions, family-oriented events, and comfort food.
Sports Teams
Sports enthusiasts will love Columbus for its major professional sports teams including the Columbus Crew (MLS) and the Blue Jackets (NHL). Fort Wayne, although lacking professional sports teams, has a dedicated fan base for its local minor league teams.


 Columbus, OH
 Fort Wayne, IN