Dallas, TX and Chula Vista, CA, are vastly different in many aspects, ranging from weather, cost of living, industries and employment opportunities, to cultural offerings. It is crucial to extend a comprehensive comparison to discern a clear picture for those intending to relocate or visit these cities. This analysis surveys crucial factors such as crime rates, education quality, healthcare services, tax levels, and sports culture to provide an exhaustive comparison.
Distance between
Dallas, TX and
Chula Vista, CA : 1,176.0 miles
Dallas's population is larger by 365%. Its population has grown by 99,877 people (8.4%) since 2000. The population of Chula Vista has grown by 103,664 people (59.7%) during that time.
Dallas, with a larger population, has a higher crime rate compared to Chula Vista. However, like many cities, crime rates vary widely among neighborhoods. The city is making concerted efforts to enhance safety. Chula Vista, on the other hand, has a lower crime rate and is deemed safer. Nevertheless, safety precautions are advised in both cities.
City-data.com crime index counts serious crimes and violent crime more heavily. It adjusts for the number of visitors and daily workers commuting into cities. (higher means more crime, U.S. average = 301.1)
City-data.com crime index counts serious crimes and violent crime more heavily. It adjusts for the number of visitors and daily workers commuting into cities. (higher means more crime, U.S. average = 301.1)
Sex Offenders
According to our data, there are 4,297 registered sex offenders living in Dallas and 204 registered sex offenders living in . The ratio of residents to sex offenders in Dallas is 307 to 1; the ratio in Chula Vista is 1,310 to 1. The number of registered sex offenders compared to the number of residents is much larger in Dallas than that in Chula Vista.
Cost of Living
Living in Chula Vista is more expensive. Property prices, food, healthcare, and general utilities command higher prices in Chula Vista compared to Dallas. The median home cost in Dallas is significantly lower, offering a more affordable lifestyle.
Income Tax
In Dallas, you'd pay no state income tax due to Texas laws but in Chula Vista, the state income tax can range from 1 to 13.3% depending on your income level.
Property Tax
Dallas has a much higher property tax rate compared to Chula Vista, something home buyers should take into account.
Sales Tax
Sales tax in Dallas is at 8.25%, while it is 8.75% in Chula Vista. Thus, Chula Vista has a marginally higher sales tax, contributing to the higher cost of living.
Income
Type
Dallas
Chula Vista
Estimated median household income
$57,995
$91,949
Estimated per capita income
$38,479
$35,138
Cost of living index (U.S. average is 100)
96.1
123.4
If you make $50,000 in Dallas, you will have to make $64,204 in Chula Vista to maintain the same standard of living.
Geographical Conditions
Dallas generally has a flat terrain with few bodies of water, while Chula Vista offers coastal landscapes with access to beaches and harbors.
Both cities have solid education systems with good public and private school options. Dallas's independent school district is one of the largest in the nation, while Chula Vista is part of the acclaimed San Diego county public school system.
Dallas is the economic hub of North Texas, and the job market is more diversified with thriving industries including energy, healthcare, and technology. Chula Vista's economy is much smaller, but it benefits from being in close proximity to San Diego and the U.S. - Mexico border, offering opportunities in tourism and international trade.
Biggest Employers
In Dallas, the biggest employers include AT&T, Texas Health Resources, and Lockheed Martin Aeronautics. Chula Vista's big employers include school districts and the local government.
There were 2,245 building permits issued in Dallas in 2012 (1436 more than in 2011) compared to 291 building permits issued in Chula Vista in 2012 (137 less than in 2011).
In Dallas (Dallas County), 57.3% voted for Democrats and 41.8% for Republicans in 2012 Presidential Election. In Chula Vista (San Diego County), 52.6% voted for Democrats and 45.0% for Republicans.
Elections
Type
Democrats
Republicans
Other
Year
Dallas
Chula Vista
Dallas
Chula Vista
Dallas
Chula Vista
2020
65.1%
60.3%
33.4%
37.5%
1.4%
2.1%
2016
60.8%
56.3%
34.7%
36.6%
4.5%
7.1%
2012
57.3%
52.6%
41.8%
45.0%
1.0%
2.4%
2008
57.4%
54.2%
42.0%
44.0%
0.6%
1.8%
2004
49.0%
46.7%
50.4%
52.9%
0.5%
0.4%
2000
45.0%
45.8%
52.7%
49.8%
2.4%
4.5%
1996
46.0%
44.1%
46.8%
45.6%
7.2%
10.3%
Breakdown of population affiliated with a religious congregation
Type
Adherents
Congregations
Religion
Dallas
Chula Vista
Dallas
Chula Vista
CATHOLIC CHURCH
18.9%
25.9%
2.4%
6.7%
SOUTHERN BAPTIST CONVENTION
11.0%
1.1%
31.1%
12.0%
MUSLIM ESTIMATE
3.6%
0.7%
1.1%
1.1%
EPISCOPAL CHURCH
1.0%
0.4%
1.5%
2.0%
SEVENTH DAY ADVENTIST CHURCH
0.5%
0.5%
1.7%
2.0%
EVANGELICAL LUTHERAN CHURCH IN AMERICA
0.3%
0.4%
0.9%
2.0%
LUTHERAN CHURCH
0.3%
0.4%
0.7%
2.2%
Weather
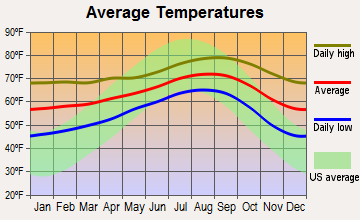
Dallas's climate is humid subtropical, with torrid summers and mild winters. Chula Vista in comparison has a Mediterranean climate with mild, wet winters and hot, dry summers - a stable climate more preferred by some.
Weather and climate
Type
Dallas
Chula Vista
Temperature - Average
66.6°F
63.9°F
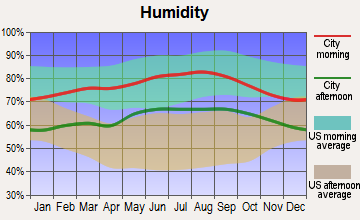
Humidity - Average morning or afternoon humidity
71.3%
74%
Humidity - Differences between morning and afternoon humidity
34%
22%
Humidity - Maximum monthly morning or afternoon humidity
82%
80%
Humidity - Minimum monthly morning or afternoon humidity
48%
58%
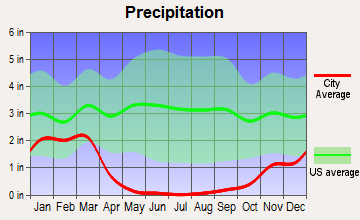
Precipitation - Yearly average
37.3 in
10.3 in
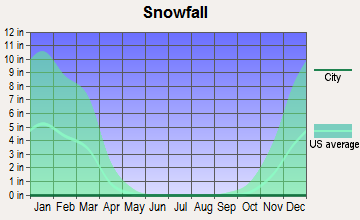
Snowfall - Yearly average
4.2 in
0 in
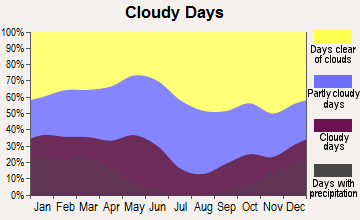
Clouds - Number of days clear of clouds
22.8%
24.3%
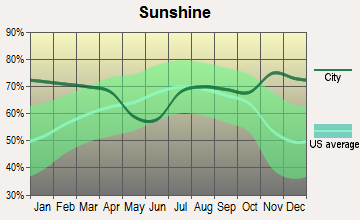
Sunshine amount - Average
66.6%
74.8%
Sunshine amount - Differences during a year
20%
19%
Sunshine amount - Maximum monthly
74%
75%
Sunshine amount - Minimum monthly
54%
56%
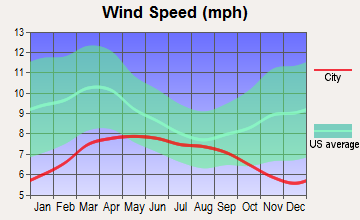
Wind speed - Average
10.3 mph
6.9 mph
Average climate in Dallas, Texas
Average climate in Chula Vista, California
Air pollution
Type
AQI
CO
NO2
OZONE
PB
PM10
PM25
SO2
Year
Dallas
Chula Vista
Chula Vista
Dallas
Chula Vista
Dallas
Chula Vista
Dallas
Chula Vista
Chula Vista
Dallas
Chula Vista
Dallas
Chula Vista
2018
86
101
0.36
N/A
5.7
8.6
28.7
29.4
N/A
0.010
N/A
N/A
9.7
11.5
0.4
0.1
2017
84
115
0.39
N/A
5.5
9.1
28.6
28.8
N/A
0.010
N/A
N/A
9.1
11.5
0.3
0.1
2016
81
105
0.34
N/A
6.1
9.1
27.2
28.6
N/A
0.010
N/A
N/A
8.4
12.0
0.2
0.1
2015
85
105
0.34
N/A
6.5
10.0
26.7
28.5
N/A
0.015
N/A
N/A
8.9
12.0
0.3
0.1
2014
83
99
0.42
N/A
6.3
10.6
27.6
26.3
N/A
0.012
N/A
N/A
9.9
10.8
0.3
0.1
2013
97
128
0.61
N/A
7.3
10.8
28.8
28.7
N/A
0.013
N/A
N/A
13.0
12.2
0.2
0.3
2012
116
107
0.54
N/A
8.6
11.1
31.0
31.2
N/A
0.013
N/A
N/A
12.0
13.6
0.3
0.2
2011
98
108
0.57
N/A
9.4
12.3
30.9
27.1
N/A
0.023
N/A
N/A
11.9
14.0
0.6
2.1
2010
79
91
0.56
N/A
9.4
12.2
28.3
33.6
N/A
0.017
N/A
N/A
N/A
N/A
0.7
1.4
2009
88
109
0.55
N/A
9.2
13.4
28.8
33.3
N/A
0.014
N/A
N/A
N/A
N/A
0.5
2.0
2008
88
401
0.60
N/A
9.8
14.8
29.2
32.7
0.121
N/A
207.2
N/A
N/A
N/A
0.5
2.3
2007
94
160
0.66
N/A
11.0
15.0
25.7
34.2
0.070
0.012
64.3
N/A
N/A
N/A
0.3
2.6
2006
107
130
0.61
N/A
10.8
16.9
30.6
32.4
0.106
0.056
64.0
N/A
N/A
N/A
0.7
3.3
2005
108
126
0.68
N/A
13.0
16.3
29.7
32.2
0.142
0.049
72.6
N/A
11.0
N/A
0.9
3.1
2004
96
116
0.72
N/A
12.3
16.0
26.0
30.6
0.099
0.055
N/A
N/A
N/A
N/A
0.8
3.1
2003
102
128
0.71
N/A
13.6
17.7
27.1
23.1
0.121
0.048
N/A
N/A
N/A
N/A
1.0
3.6
2002
100
125
0.74
N/A
14.0
17.7
25.2
30.7
0.080
0.015
N/A
N/A
N/A
N/A
0.4
3.7
2001
100
129
0.81
N/A
14.3
16.9
26.0
30.8
0.069
0.029
N/A
N/A
N/A
N/A
1.0
3.3
2000
109
132
0.84
N/A
14.5
16.9
27.0
28.4
0.092
0.045
N/A
N/A
N/A
N/A
1.1
2.7
Natural disasters
Type
Dallas
Chula Vista
Tornado activity compared to U.S. average
254.7%
5%
Earthquake activity compared to U.S. average
567%
5,616.5%
Natural disasters compared to U.S. average
21%
39%
Transportation
Dallas offers extensive public bus and rail transportation with a broader commute range. Chula Vista's public transit is less extensive, but the city benefits from proximity to San Diego Metropolitan transit systems.
Transport
Type
Dallas
Chula Vista
Amtrak stations
1
0
Amtrak stations nearby
1
1
FAA registered aircraft
2
59
FAA registered aircraft manufacturers and dealers
56
0
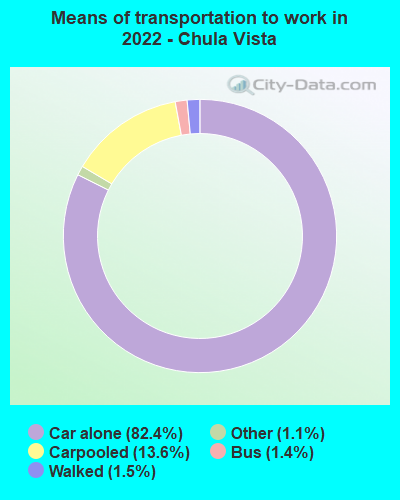
Means of transportation to work
Type
Dallas
Chula Vista
Bicycle
0.3%
0.2%
Bus
1.4%
2.6%
Carpooled
10.9%
10%
Car alone
83.9%
79.6%
Motorcycle
0%
0.3%
Railroad
0.2%
0.4%
Streetcar
0.1%
0.2%
Subway
0.2%
0%
Taxicab
0.1%
0.1%
Walked
1.6%
3.6%
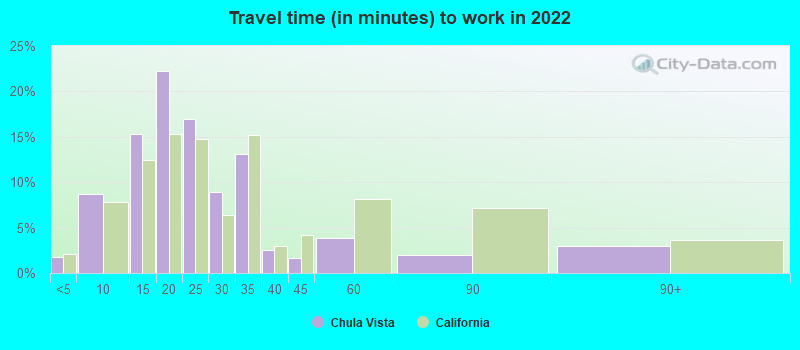
Average travel time to work
Type
Dallas
Chula Vista
Average
31.5 min
23 min
Other means
26.5 min
26.2 min
Public transportation
46 min
46.6 min
Private vehicle occupancy
Type
Dallas
Chula Vista
Average
1.2
1.2
Drove alone
86.8%
88.5%
In 2 person carpool
9%
8.2%
In 3 person carpool
2.6%
2.1%
In 4 person carpool
0.9%
0.9%
In 5-6 person carpool
0.5%
0.3%
In 7+ person carpool
0.2%
0%
How many people usually rode to work in the car, truck or van.
Real Estate
Dallas has a more affordable real estate market. However, Chula Vista offers a range of properties against the backdrop of beautiful Californian landscapes.
Neighborhoods
Both Dallas and Chula Vista host a variety of neighborhoods to suit different lifestyles. Uptown and Bishop Arts District in Dallas are popular while Eastlake and Otay Ranch are sought-after in Chula Vista.
Houses and residents
Type
Dallas
Chula Vista
Houses
591,773
88,821
Average household size (people)
2.6
3.2
Median year apartment built
1987
1982
Median year house/condo built
1969
1990
Length of stay in the house since moving in
13.9 years
13.2 years
Houses occupied
536,008 (90.6%)
83,451 (94%)
Houses occupied by owners
229,518 (42.8%)
48,589 (58.2%)
Houses occupied by renters
306,490 (57.2%)
34,862 (41.8%)
Median rent asked for vacant for-rent units
$1,403
$1,736
Median monthly housing costs
$1,225
$2,012
Median price asked for vacant for-sale houses and condos
$574,934
$648,184
Estimated median house or condo value
$267,600
$655,100
Median numbers of rooms
4.6
4.9
Median number of rooms in apartments
3.7
3.8
Median number of rooms in houses and condos
6.1
6
Median house price - detached houses
$410,272
$656,786
Median house price - in 2-unit structures
$255,160
$397,704
Median house price - in 3-to-4-unit structures
$230,927
$379,885
Median house price - in 5 or more unit structures
$444,589
$375,564
Median house price - mobile homes
$91,039
$80,419
Median house price - Townhouses or other attached units
$350,045
$474,754
Median house price - All housing units
$402,215
$579,650
Median house age
40
36
Renting percentage
55.9%
41.9%
Housing density (houses/condos per square mile)
1,727.6
1,817.2
House value disparities
41.3%
19.7%
Household income disparities
48.2%
41.7%
Median household income for houses/condes with a mortgage
$103,798
$133,618
Median household income for apartments without a mortgage
$61,909
$73,475
Housing units without a mortgage
1,309 (1%)
303 (0.9%)
Housing units with both a second mortgage and home equity loan
3,320 (2.6%)
2,201 (6.5%)
Housing units with a mortgage
124,846 (99%)
33,694 (99.1%)
Housing units with a home equity loan
204 (0.2%)
0 (0%)
Housing units with a second mortgage
5,351 (4.2%)
2,899 (8.5%)
House/condo owner moved in on average (years ago)
12
11
House/condo renter moved in on average (years ago)
1
3
Housing units lacking complete kitchen facilities
1.2%
1.5%
Housing units lacking complete plumbing facilities
0.9%
0.6%
Housing units in structures
Housing units in structures
Dallas
Chula Vista
One, detached
41.8%
53.2%
One, attached
4.3%
13.4%
Two
1.5%
1.3%
3 or 4
4.9%
4.9%
5 to 9
7.9%
3.8%
10 to 19
12.1%
5.7%
20 to 49
8.1%
5.0%
50 or more
18.4%
8.3%
Mobile homes
1.0%
4.3%
Boats, RVs, vans, etc.
0.0%
0.1%
Median real estate property taxes paid for housing units
Self-employed workers in own not incorporated business
43,703
9,347
State government workers
17,325
7,115
Unpaid family workers
754
174
Industries and Occupations
Chula Vista has tourism, retail and education as dominant sectors. Dallas, however, touts a more diverse economy with sectors such as technology, engineering, healthcare and finance leading.
Dallas has world-class healthcare facilities with some highly-rated hospitals. Chula Vista, while smaller, forms part of the larger San Diego county healthcare system, also known for its excellent healthcare facilities. Significantly, healthcare costs are generally higher in Chula Vista compared to Dallas.
Health (county statistics)
Type
Dallas
Chula Vista
General health status score of residents in this county from 1 (poor) to 5 (excellent)
Dallas boasts a robust network of highways, expansive international airport, and fast rail lines. Chula Vista's infrastructure is not as extensive, but it is well-connected to the larger San Diego Metropolitan Area.
Infrastructure
Type
Dallas
Chula Vista
Hospitals
74
3
TV stations
25
12
Bank branches located here
394
41
Bank institutions located here
80
15
Drinking water stations with no reported violations in the past
8
0
Drinking water stations with reported violations in the past
HMDA - Conventional home purchase loans - Applications denied
Year
Dallas
Chula Vista
1999
5,030
603
2000
3,390
217
2001
2,626
191
2002
2,657
242
2003
3,617
1,205
2004
5,460
2,345
2005
7,445
2,433
2006
7,397
1,869
2007
5,056
1,389
2008
2,200
749
2009
1,121
300
Culture and Food
Dallas boasts a diverse culture with a lively arts scene, music festivals and Texas-style barbeque cuisine. Chula Vista, part of the greater San Diego area, offers Californian coastal culture and mouth-watering Mexican-American fare.
Sports Teams
Both cities have plenty to offer for sports enthusiasts. Dallas has the Cowboys (NFL), the Mavericks (NBA), and the Stars (NHL), while Chula Vista residents support San Diego teams like the Chargers (NFL) and the Padres (MLB).


 Dallas, TX
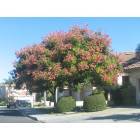
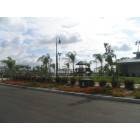
 Chula Vista, CA