Dallas, TX and South Coast, CA both offer a unique array of experiences for residents and visitors. While Dallas is better known for its expansive economy, low cost of living, and vibrant sports culture, South Coast boasts a more relaxed lifestyle, beautiful beaches, and a higher emphasis on education. Both cities have their own character and are appealing based on the needs and preferences of different individuals.
When considering the aspect of crime and safety, both Dallas and South Coast have their challenges. Dallas has a higher crime rate compared to the national average. The city has implemented programs to curb crime, but it remains a point of concern. On the other hand, South Coast, CA, depending on the specific city, typically exhibits a lower crime rate than Dallas, but more significantly, reduced serious crimes when compared to the national average in the US.
Cost of Living
The cost of living in Dallas is significantly lower than in South Coast, CA. This is mostly due to Texas' lower housing cost, as well as grocery and healthcare costs. In contrast, South Coast is one of the most expensive regions of California to live in, mostly due to high real estate prices.
Income Tax
Texas does not impose a state income tax, a relief for many transplants from other states. On the other hand, California has the highest state income tax in the country, with rates that can exceed 13% for higher-income earners.
Property Tax
Despite Texas not having a state income tax, it imposes one of the highest property tax rates in the country. Conversely, California has lower property tax rates compared to the national average, somewhat offsetting its high income taxes.
Sales Tax
Texas does not have a state income tax, but it does apply a 6.25% sales tax. California has a higher state sales tax at 7.25%, with local municipalities adding further amounts.
Income
Type
Dallas
South Coast
Estimated median household income
$57,995
$112,870
Estimated per capita income
$38,479
$68,453
Cost of living index (U.S. average is 100)
96.1
96.8
If you make $50,000 in Dallas, you will have to make $50,364 in South Coast to maintain the same standard of living.
Geographical Conditions
Dallas is located in the flat plains of Texas with no nearby bodies of water, making it prone to hot weather and thunderstorms. The South Coast boasts beautiful beaches, oceanic views and mountainous landscapes that offer a variety of outdoor activities.
Geographical information
Type
Dallas
South Coast
Land area
342.5 sq. miles
101 sq. miles
Population density
3,761.4 people per sq. mile
2,953.2 people per sq. mile
Relative area comparison
Dallas, TX South Coast, CA
Education
Both regions are invested in education. Dallas has various credible schools and is home to multiple universities, including Southern Methodist University. Additionally, it has a comparatively higher percentage of residents with college degrees than national average. Meanwhile, South Coast is known for its high-quality education systems, including prestigious universities like Irvine and Costa Mesa.
Dallas has a thriving economy with sectors such as technology, healthcare, and finance contributing significantly. The employment rate is quite high, and the city is home to numerous Fortune 500 companies. South Coast has a diverse economy with sectors ranging from tourism to technology. However, its job market is more competitive due to higher living costs.
Biggest Employers
Dallas' biggest employers include major corporations like AT&T, Texas Health Resources, and American Airlines. In South Coast, major employers are largely in the tech industry, including companies like Broadcom and Blizzard Entertainment.
In Dallas (Dallas County), 57.3% voted for Democrats and 41.8% for Republicans in 2012 Presidential Election. In South Coast (Orange County), 45.8% voted for Democrats and 52.0% for Republicans.
Elections
Type
Democrats
Republicans
Other
Year
Dallas
South Coast
Dallas
South Coast
Dallas
South Coast
2020
65.1%
53.6%
33.4%
44.6%
1.4%
1.8%
2016
60.8%
50.9%
34.7%
42.4%
4.5%
6.7%
2012
57.3%
45.8%
41.8%
52.0%
1.0%
2.3%
2008
57.4%
47.8%
42.0%
50.3%
0.6%
1.9%
2004
49.0%
39.3%
50.4%
60.2%
0.5%
0.5%
2000
45.0%
40.4%
52.7%
55.9%
2.4%
3.7%
1996
46.0%
37.9%
46.8%
51.7%
7.2%
10.5%
Breakdown of population affiliated with a religious congregation
Type
Adherents
Congregations
Religion
Dallas
South Coast
Dallas
South Coast
CATHOLIC CHURCH
18.9%
26.5%
2.4%
4.4%
SOUTHERN BAPTIST CONVENTION
11.0%
2.3%
31.1%
8.8%
MUSLIM ESTIMATE
3.6%
0.8%
1.1%
1.3%
EPISCOPAL CHURCH
1.0%
0.4%
1.5%
1.4%
SEVENTH DAY ADVENTIST CHURCH
0.5%
0.4%
1.7%
1.3%
EVANGELICAL LUTHERAN CHURCH IN AMERICA
0.3%
0.4%
0.9%
2.3%
LUTHERAN CHURCH
0.3%
0.6%
0.7%
2.0%
REFORMED CHURCH IN AMERICA
0.0%
0.3%
0.0%
0.2%
Weather
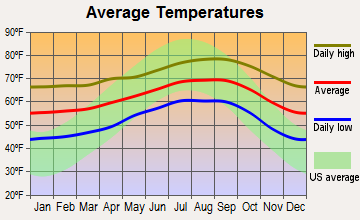
The weather varies significantly between Texas and California. Dallas experiences hot, humid summers and mild winters. The city also deals with occasional severe weather like thunderstorms and occasional tornadoes. In contrast, South Coast enjoys a Mediterranean climate with warm, dry summers and mild, wet winters, offering a more consistent climate year-round.
Weather and climate
Type
Dallas
South Coast
Temperature - Average
66.6°F
62.1°F
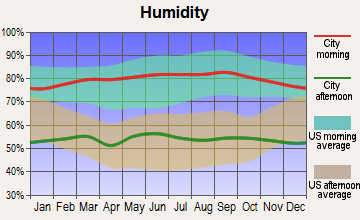
Humidity - Average morning or afternoon humidity
71.3%
69.1%
Humidity - Differences between morning and afternoon humidity
34%
24.6%
Humidity - Maximum monthly morning or afternoon humidity
82%
77%
Humidity - Minimum monthly morning or afternoon humidity
48%
52.4%
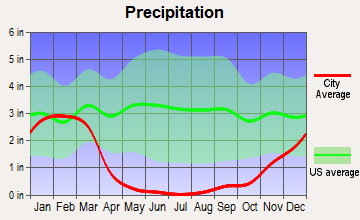
Precipitation - Yearly average
37.3 in
13.4 in
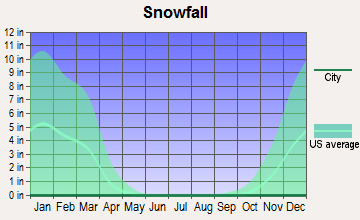
Snowfall - Yearly average
4.2 in
0 in
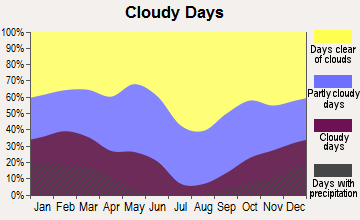
Clouds - Number of days clear of clouds
22.8%
26.7%
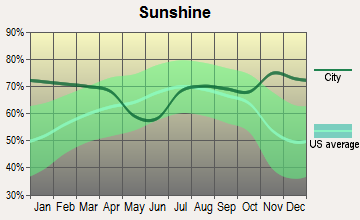
Sunshine amount - Average
66.6%
77.6%
Sunshine amount - Differences during a year
20%
20.5%
Sunshine amount - Maximum monthly
74%
81.9%
Sunshine amount - Minimum monthly
54%
61.4%
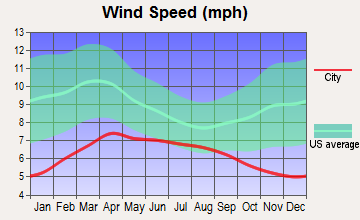
Wind speed - Average
10.3 mph
5.5 mph
Average climate in Dallas, Texas
Average climate in South Coast, California
Air pollution
Type
AQI
CO
NO2
OZONE
PB
PM10
PM25
SO2
Year
Dallas
South Coast
South Coast
Dallas
South Coast
Dallas
South Coast
Dallas
South Coast
Dallas
South Coast
Dallas
South Coast
2018
86
105
0.18
N/A
5.7
8.6
28.7
34.0
N/A
N/A
22.7
N/A
9.7
7.0
0.4
N/A
2017
84
111
0.21
N/A
5.5
8.4
28.6
34.7
N/A
N/A
23.0
N/A
9.1
11.3
0.3
N/A
2016
81
105
0.14
N/A
6.1
9.6
27.2
33.8
N/A
N/A
21.9
N/A
8.4
9.8
0.2
0.1
2015
85
111
0.10
N/A
6.5
10.5
26.7
32.9
N/A
N/A
19.4
N/A
8.9
10.5
0.3
0.1
2014
83
100
0.11
N/A
6.3
9.8
27.6
31.3
N/A
N/A
25.4
N/A
9.9
11.8
0.3
0.3
2013
97
97
0.17
N/A
7.3
10.6
28.8
30.0
N/A
N/A
24.5
N/A
13.0
10.3
0.2
0.2
2012
116
101
0.26
N/A
8.6
10.1
31.0
29.9
N/A
N/A
21.5
N/A
12.0
10.5
0.3
0.1
2011
98
113
0.15
N/A
9.4
10.2
30.9
30.3
N/A
N/A
24.0
N/A
11.9
10.9
0.6
0.3
2010
79
101
0.21
N/A
9.4
10.9
28.3
30.6
N/A
N/A
23.3
N/A
N/A
11.4
0.7
0.6
2009
88
120
0.15
N/A
9.2
13.0
28.8
31.5
N/A
N/A
27.3
N/A
N/A
12.4
0.5
1.1
2008
88
131
0.26
N/A
9.8
13.2
29.2
32.0
0.121
N/A
38.8
N/A
N/A
9.4
0.5
1.1
2007
94
110
0.24
N/A
11.0
13.7
25.7
30.6
0.070
N/A
N/A
N/A
N/A
N/A
0.3
0.8
2006
107
112
0.30
N/A
10.8
14.8
30.6
30.6
0.106
N/A
N/A
N/A
N/A
N/A
0.7
1.3
2005
108
109
0.28
N/A
13.0
13.7
29.7
29.9
0.142
N/A
N/A
N/A
11.0
N/A
0.9
1.3
2004
96
130
0.29
N/A
12.3
15.5
26.0
32.5
0.099
N/A
N/A
N/A
N/A
N/A
0.8
1.6
2003
102
132
0.38
N/A
13.6
18.2
27.1
31.3
0.121
N/A
N/A
N/A
N/A
N/A
1.0
1.1
2002
100
129
0.40
N/A
14.0
17.7
25.2
28.4
0.080
N/A
N/A
N/A
N/A
N/A
0.4
1.6
2001
100
137
0.52
N/A
14.3
18.5
26.0
27.8
0.069
N/A
N/A
N/A
N/A
N/A
1.0
1.4
2000
109
140
0.52
N/A
14.5
21.2
27.0
24.5
0.092
N/A
N/A
N/A
N/A
N/A
1.1
1.9
Natural disasters
Type
Dallas
South Coast
Tornado activity compared to U.S. average
254.7%
17.1%
Earthquake activity compared to U.S. average
567%
6,728.5%
Natural disasters compared to U.S. average
21%
32%
Transportation
Dallas provides diversified transportation options, including an extensive freeway system, Dallas Area Rapid Transit (DART), and the Dallas/Fort Worth International Airport. South Coast primarily relies on personal vehicles and offers limited public transportation options. However, it boasts a less congested commuting experience.
Transport
Type
Dallas
South Coast
Amtrak stations
1
0
Amtrak stations nearby
1
3
FAA registered aircraft
2
0
FAA registered aircraft manufacturers and dealers
56
0
Means of transportation to work
Type
Dallas
South Coast
Bicycle
0.3%
0.3%
Bus
1.4%
1%
Carpooled
10.9%
10.5%
Car alone
83.9%
79.2%
Motorcycle
0%
0.2%
Railroad
0.2%
0.4%
Subway
0.2%
0%
Taxicab
0.1%
0%
Walked
1.6%
1.7%
Average travel time to work
Type
Dallas
South Coast
Average
31.5 min
27.9 min
Real Estate
Real estate in Dallas is considerably more affordable than in South Coast, with lower median home prices. South Coast, on the other hand, is one of the priciest real estate markets in the country given its attractive coastal location.
Neighborhoods
Dallas offers a mix of urban, suburban, and rural neighborhoods, suiting a variety of lifestyles. South Coast cities, such as Laguna Beach and Newport Beach, offer more upscale, beach-front neighborhoods and often cater to a wealthier demographic.
Houses and residents
Type
Dallas
South Coast
Houses
591,773
124,031
Average household size (people)
2.6
2.5
Houses occupied
536,008 (90.6%)
117,093 (94.4%)
Houses occupied by owners
229,518 (42.8%)
81,601 (69.7%)
Houses occupied by renters
306,490 (57.2%)
35,492 (30.3%)
Median rent asked for vacant for-rent units
$1,403
$2,718
Median price asked for vacant for-sale houses and condos
$574,934
$1,099,558
Estimated median house or condo value
$267,600
Over $1,000,000
Median number of rooms in apartments
3.7
3.9
Median number of rooms in houses and condos
6.1
5.1
Renting percentage
55.9%
33.8%
Housing density (houses/condos per square mile)
1,727.6
1,227.5
Household income disparities
48.2%
38.1%
Housing units without a mortgage
1,309 (1%)
10,715 (16.4%)
Housing units with both a second mortgage and home equity loan
3,320 (2.6%)
248 (0.4%)
Housing units with a mortgage
124,846 (99%)
54,674 (83.6%)
Housing units with a home equity loan
204 (0.2%)
5,859 (9%)
Housing units with a second mortgage
5,351 (4.2%)
7,560 (11.6%)
Housing units lacking complete kitchen facilities
1.2%
0.8%
Housing units lacking complete plumbing facilities
Self-employed workers in own not incorporated business
43,703
17,244
State government workers
17,325
4,403
Unpaid family workers
754
640
Industries and Occupations
Industries in Dallas are centered around finance, technology, defense, and transportation. In South Coast, the dominant industries include technology, tourism, agriculture, and entertainment.
Dallas provides excellent healthcare services with some nationally ranked hospitals like UT Southwestern Medical Center. South Coast also offers high-quality healthcare facilities, including Hoag Memorial Hospital and Orange County Global Medical Center.
Health (county statistics)
Type
Dallas
South Coast
General health status score of residents in this county from 1 (poor) to 5 (excellent)
Dallas boasts a robust infrastructure, with an international airport and extensive highway system connecting it to other parts of the country. It also hosts modern skyscrapers and commercial facilities. South Coast, not to be outdone, offers wonderful coastal highways, marinas, resorts, and world-class public facilities.
Infrastructure
Type
Dallas
South Coast
TV stations
25
1
Nuclear power plants nearby
0
2
Culture and Food
Dallas offers rich cultural experiences, including diverse music, art, and a remarkable food scene, particularly known for its barbecued food. South Coast provides a laid-back, active outdoor culture with year-round festivals and a food scene dominated by fresh, local produce and seafood.
Sports Teams
Dallas is big on sports with popular teams like the Dallas Cowboys (NFL), Dallas Mavericks (NBA), and Texas Rangers (MLB). South Coast lacks major sports teams, but fans still enjoy a variety of local sports and are in proximity to major teams in Los Angeles.
 Dallas, TX
 South Coast, CA