Both El Paso and Laredo are located in the US state of Texas, with El Paso being considerably larger and offering more job opportunities, while Laredo provides a lower cost of living. Each city boasts specific cultural appeals, with El Paso's Mexican influence and Laredo's historic culture. Both cities offer a unique way of life with varying opportunities in terms of education, work, economy, and lifestyles. Whether you're relocating or just visiting, the cities offer diverse experiences.
Distance between
El Paso, TX and
Laredo, TX : 509.8 miles
El Paso's population is larger by 165%. Its population has grown by 114,753 people (20.4%) since 2000. The population of Laredo has grown by 79,577 people (45.1%) during that time.
When it comes to safety, El Paso is often ranked as one of the safest large cities in the United States. This is a solid selling point for both residents and tourists. Laredo, while having higher crime rates than El Paso, is still considered relatively safe compared to other US cities of similar size. Nonetheless, it's always important to take precautions and be aware of your surroundings no matter where you live or visit.
City-data.com crime index counts serious crimes and violent crime more heavily. It adjusts for the number of visitors and daily workers commuting into cities. (higher means more crime, U.S. average = 301.1)
City-data.com crime index counts serious crimes and violent crime more heavily. It adjusts for the number of visitors and daily workers commuting into cities. (higher means more crime, U.S. average = 301.1)
Sex Offenders
According to our data, there are 1,274 registered sex offenders living in El Paso and 266 registered sex offenders living in . The ratio of residents to sex offenders in El Paso is 536 to 1; the ratio in Laredo is 978 to 1. The number of registered sex offenders compared to the number of residents is larger in El Paso than in Laredo.
Cost of Living
In terms of cost of living, Laredo is somewhat more affordable than El Paso. Housing costs are lower in Laredo, although El Paso is still cheaper than the national average. Both cities provide a cost-effective option for residents and tourists alike, providing value for money in terms of housing, food, and entertainment.
Income Tax
Neither El Paso nor Laredo has a city income tax, and Texas is one of the few states that does not have a state income tax. This is a significant advantage for residents who may be considering relocating to one of these cities.
Property Tax
While Texas has no state property tax, cities and counties do levy property taxes, and these can fluctuate depending on the specific area. Both El Paso and Laredo have comparable property tax rates.
Sales Tax
The combined sales tax rates for both cities are fairly similar. Laredo's sales tax is about 8.25%, while in El Paso it's around 8.25% as well. Texas, as a state, does not have an income tax.
Income
Type
El Paso
Laredo
Estimated median household income
$51,241
$52,438
Estimated per capita income
$25,670
$21,785
Cost of living index (U.S. average is 100)
82.2
82.6
If you make $50,000 in El Paso, you will have to make $50,243 in Laredo to maintain the same standard of living.
Geographical Conditions
El Paso is situated in the Chihuahuan Desert, with beautiful mountain ranges nearby including the Franklin Mountains State Park. Laredo is located on the north bank of the Rio Grande River, providing scenic views and opportunities for water-related activities.
El Paso has a number of highly regarded school districts, as well as higher education institutions, including The University of Texas at El Paso. Laredo, being smaller, has fewer options but does maintain a branch of Texas A&M University. Both cities are serviceable for education, although El Paso provides more varied choices.
El Paso has a diverse economy with major sectors including defense and healthcare. Laredo is a major transport and trade hub due to its location on the border with Mexico, contributing significantly to its economy. Employment opportunities can be found in both cities, with El Paso offering more diversity in terms of job sectors.
Biggest Employers
In El Paso, major employers include University Medical Center of El Paso and The University of Texas at El Paso. Laredo's principal employers are in the logistics and transportation sector, with names such as International Bancshares Corp and Union Pacific Railroad noted.
There were 1,961 building permits issued in El Paso in 2012 (1005 less than in 2011) compared to 1,462 building permits issued in Laredo in 2012 (822 more than in 2011).
In El Paso (El Paso County), 65.5% voted for Democrats and 33.2% for Republicans in 2012 Presidential Election. In Laredo (Webb County), 76.4% voted for Democrats and 22.5% for Republicans.
Elections
Type
Democrats
Republicans
Other
Year
El Paso
Laredo
El Paso
Laredo
El Paso
Laredo
2020
66.8%
61.1%
31.6%
37.9%
1.6%
1.0%
2016
69.1%
74.4%
26.0%
22.8%
4.9%
2.9%
2012
65.5%
76.4%
33.2%
22.5%
1.3%
1.1%
2008
66.0%
71.5%
33.4%
28.0%
0.6%
0.4%
2004
56.2%
57.0%
43.3%
42.7%
0.5%
0.3%
2000
57.9%
57.6%
39.8%
41.6%
2.3%
0.8%
1996
62.3%
76.7%
32.1%
19.0%
5.6%
4.3%
Breakdown of population affiliated with a religious congregation
Type
Adherents
Congregations
Religion
El Paso
Laredo
El Paso
Laredo
CATHOLIC CHURCH
43.2%
50.6%
11.3%
18.8%
SOUTHERN BAPTIST CONVENTION
3.3%
1.2%
26.6%
21.0%
MUSLIM ESTIMATE
0.1%
1.0%
0.2%
0.7%
Weather
El Paso has sunny weather with over 300 sunny days a year and moderate precipitation. The winters are mild while the summers can be quite hot. On the other hand, Laredo has a semi-arid climate, featuring hot summers and mild winters. If you're not a fan of the cold, both cities offer warm climates, with Laredo being typically a few degrees hotter than El Paso.
Weather and climate
Type
El Paso
Laredo
Temperature - Average
64.6°F
73.9°F
Humidity - Average morning or afternoon humidity
42.7%
80%
Humidity - Differences between morning and afternoon humidity
42.8%
36.1%
Humidity - Maximum monthly morning or afternoon humidity
59.8%
91.2%
Humidity - Minimum monthly morning or afternoon humidity
17%
55.1%
Precipitation - Yearly average
9.4 in
21.5 in
Snowfall - Yearly average
10.7 in
0.3 in
Clouds - Number of days clear of clouds
31.8%
17.3%
Sunshine amount - Average
89.4%
64.3%
Sunshine amount - Differences during a year
13.9%
35.1%
Sunshine amount - Maximum monthly
89.3%
78.3%
Sunshine amount - Minimum monthly
75.4%
43.1%
Wind speed - Average
8.9 mph
12.1 mph
Average climate in El Paso, Texas
Average climate in Laredo, Texas
Air pollution
Type
AQI
CO
NO2
OZONE
PB
PM10
PM25
SO2
Year
El Paso
Laredo
El Paso
Laredo
El Paso
El Paso
Laredo
El Paso
Laredo
El Paso
Laredo
El Paso
El Paso
2018
139
44
0.17
0.20
14.0
N/A
32.0
24.2
N/A
N/A
35.7
N/A
9.2
N/A
N/A
N/A
2017
173
N/A
0.19
N/A
13.0
N/A
30.5
N/A
N/A
N/A
40.4
N/A
9.5
N/A
0.5
N/A
2016
148
37
0.17
0.37
12.6
N/A
30.6
20.0
N/A
N/A
35.2
N/A
9.2
N/A
0.5
N/A
2015
112
41
0.18
0.26
12.7
N/A
30.8
21.1
N/A
N/A
31.2
N/A
8.0
N/A
0.5
N/A
2014
157
43
0.13
0.24
12.8
N/A
30.0
22.6
N/A
N/A
40.3
N/A
9.7
N/A
0.4
N/A
2013
211
51
0.23
0.12
14.1
N/A
30.5
23.5
N/A
N/A
43.9
N/A
10.8
N/A
0.4
N/A
2012
229
N/A
0.30
N/A
15.9
N/A
31.6
N/A
N/A
N/A
40.2
N/A
11.6
N/A
0.4
N/A
2011
221
55
0.23
N/A
15.9
N/A
31.2
28.3
N/A
N/A
34.7
N/A
11.6
N/A
0.5
N/A
2010
211
54
0.25
0.40
15.3
N/A
29.4
22.4
N/A
N/A
28.8
22.3
7.9
N/A
0.3
N/A
2009
117
50
0.23
0.41
15.4
N/A
29.5
22.3
N/A
N/A
28.6
25.1
8.3
N/A
0.3
N/A
2008
210
62
0.25
0.40
15.2
N/A
30.1
20.5
0.017
0.009
34.6
28.0
9.7
N/A
0.6
N/A
2007
134
63
0.28
0.54
13.9
N/A
30.6
22.2
0.019
0.009
40.5
29.5
8.4
N/A
0.4
N/A
2006
241
116
0.37
0.52
14.3
N/A
30.6
21.6
0.018
0.010
55.0
39.3
11.1
N/A
0.3
N/A
2005
159
66
0.43
0.53
13.1
N/A
29.6
22.3
0.013
0.013
44.5
27.5
9.6
N/A
0.6
N/A
2004
183
57
0.38
0.57
13.5
N/A
29.2
22.4
0.020
0.012
47.3
24.2
8.2
N/A
0.4
N/A
2003
278
62
0.46
0.79
15.5
N/A
29.5
24.0
0.039
0.011
60.4
N/A
10.8
N/A
0.6
N/A
2002
203
58
0.43
0.84
16.4
N/A
30.5
24.5
0.034
0.008
53.3
N/A
11.0
N/A
0.4
N/A
2001
139
55
0.51
0.85
15.5
N/A
28.7
22.8
0.046
0.013
N/A
N/A
9.8
N/A
0.7
N/A
2000
145
60
0.67
0.95
17.8
N/A
27.8
22.5
0.072
0.020
N/A
N/A
9.1
N/A
1.0
N/A
Natural disasters
Type
El Paso
Laredo
Tornado activity compared to U.S. average
4.2%
9.6%
Earthquake activity compared to U.S. average
524.4%
58.7%
Natural disasters compared to U.S. average
11%
16%
Transportation
Both cities are served by international airports and have good road networks. Public transit is more developed in El Paso, with the Sun Metro service offering extensive bus routes throughout the city. In Laredo, the ‘El Metro’ bus system provides public transportation within the city.
Transport
Type
El Paso
Laredo
Amtrak stations
1
1
Amtrak stations nearby
1
1
FAA registered aircraft
331
135
FAA registered aircraft manufacturers and dealers
6
7
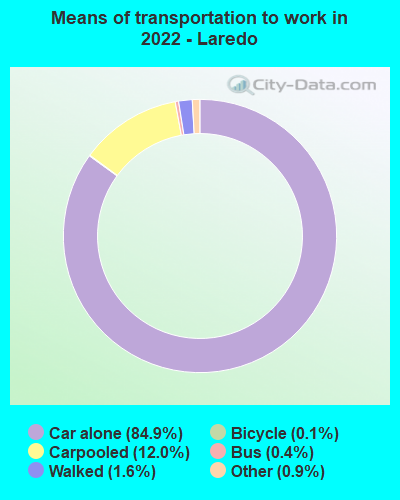
Means of transportation to work
Type
El Paso
Laredo
Bicycle
0.3%
0.1%
Bus
1.3%
1.2%
Carpooled
11.2%
12%
Car alone
83.4%
83.1%
Motorcycle
0.2%
0.1%
Streetcar
0%
0.1%
Walked
1.6%
1.2%
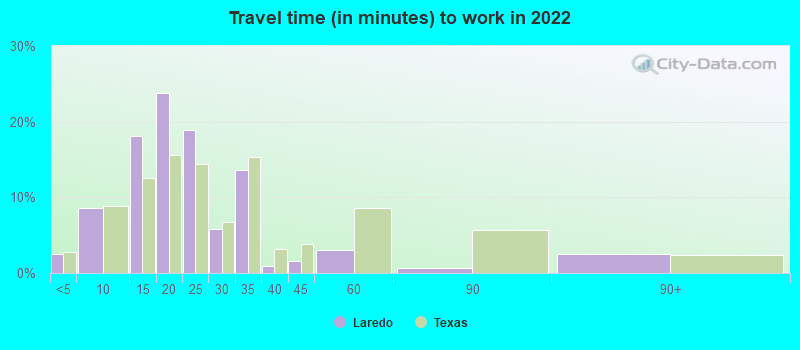
Average travel time to work
Type
El Paso
Laredo
Average
25.1 min
21.3 min
Other means
22.2 min
21.3 min
Public transportation
46.4 min
40.7 min
Private vehicle occupancy
Type
El Paso
Laredo
Average
1.2
1.2
Drove alone
88.5%
87%
In 2 person carpool
7.9%
8.8%
In 3 person carpool
2.1%
2.8%
In 4 person carpool
0.7%
0.8%
In 5-6 person carpool
0.7%
0.4%
In 7+ person carpool
0.1%
0.1%
How many people usually rode to work in the car, truck or van.
Real Estate
While both cities have affordable housing markets by national standards, Laredo tends to be cheaper than El Paso. However, El Paso often has more variety in its housing stock, with a range of different properties available to suit different tastes and budgets.
Neighborhoods
El Paso offers residents a plethora of neighborhood choices, from the bustling Downtown district to the tranquil Coronado area. For a smaller city, Laredo still provides diversity in its neighborhoods, including the historic downtown district and the tranquil Lakeside area.
Houses and residents
Type
El Paso
Laredo
Houses
261,779
82,105
Average household size (people)
3
3.7
Median year apartment built
1982
1993
Median year house/condo built
1985
1999
Length of stay in the house since moving in
14.7 years
14.3 years
Houses occupied
242,529 (92.6%)
76,095 (92.7%)
Houses occupied by owners
147,788 (60.9%)
48,145 (63.3%)
Houses occupied by renters
94,741 (39.1%)
27,950 (36.7%)
Median rent asked for vacant for-rent units
$570.82
$660.71
Median monthly housing costs
$939
$895
Median price asked for vacant for-sale houses and condos
$227,007
$131,192
Estimated median house or condo value
$152,800
$157,400
Median numbers of rooms
5.4
5.1
Median number of rooms in apartments
4.3
4.1
Median number of rooms in houses and condos
6.2
5.7
Median house price - detached houses
$187,761
$200,897
Median house price - in 2-unit structures
Over $1,000,000
$236,063
Median house price - in 3-to-4-unit structures
$75,782
$131,179
Median house price - in 5 or more unit structures
$266,003
$140,731
Median house price - mobile homes
$43,095
$84,838
Median house price - Townhouses or other attached units
$149,459
$167,216
Median house price - All housing units
$186,951
$187,779
Median house age
38
25
Renting percentage
39.6%
36.3%
Housing density (houses/condos per square mile)
1,051
1,046.5
House value disparities
32.7%
37.1%
Household income disparities
46.6%
46.4%
Median household income for houses/condes with a mortgage
$74,665
$78,507
Median household income for apartments without a mortgage
$52,954
$53,572
Housing units without a mortgage
1,889 (2.2%)
313 (1.2%)
Housing units with both a second mortgage and home equity loan
2,956 (3.4%)
431 (1.6%)
Housing units with a mortgage
84,973 (97.8%)
25,985 (98.8%)
Housing units with a home equity loan
250 (0.3%)
3 (0%)
Housing units with a second mortgage
3,635 (4.2%)
605 (2.3%)
House/condo owner moved in on average (years ago)
14
13
House/condo renter moved in on average (years ago)
1
1
Housing units lacking complete kitchen facilities
2%
3%
Housing units lacking complete plumbing facilities
2%
2.6%
Housing units in structures
Housing units in structures
El Paso
Laredo
One, detached
67.7%
66.4%
One, attached
4.4%
2.3%
Two
2.4%
1.7%
3 or 4
4.1%
5.7%
5 to 9
5.9%
3.9%
10 to 19
5.8%
2.6%
20 to 49
2.4%
1.5%
50 or more
4.8%
5.6%
Mobile homes
2.3%
9.8%
Boats, RVs, vans, etc.
0.2%
0.6%
Median real estate property taxes paid for housing units
Self-employed workers in own not incorporated business
19,650
5,131
State government workers
12,525
4,703
Unpaid family workers
901
395
Industries and Occupations
In El Paso, the healthcare, education, and defense sectors are significant employers. Laredo has a strong focus on trade, logistics, and transportation industries. Job seekers and those wishing to build a career in these sectors will find opportunities in both cities.
El Paso has a number of hospitals, including the highly regarded University Medical Center of El Paso. Laredo has a few hospitals, including the Laredo Medical Center. Both cities offer comprehensive healthcare services, but El Paso has a larger number of facilities and specialists to choose from.
Health (county statistics)
Type
El Paso
Laredo
General health status score of residents in this county from 1 (poor) to 5 (excellent)
El Paso has developed infrastructure with excellent healthcare facilities, schools, and public services. Laredo, while smaller, has a substantial infrastructure network to support its role as a key trade hub. Both cities feature international airports and well-maintained road networks supporting commuting and transportation.
Infrastructure
Type
El Paso
Laredo
Hospitals
41
11
TV stations
10
7
Arenas or stadiums
2
1
Bank branches located here
89
56
Bank institutions located here
19
13
Main business address for public companies
7
1
Drinking water stations with no reported violations in the past
0
2
Drinking water stations with reported violations in the past
HMDA - Conventional home purchase loans - Applications denied
Year
El Paso
Laredo
1999
1,994
2,067
2000
993
823
2001
704
343
2002
594
155
2003
1,268
330
2004
1,646
450
2005
2,316
645
2006
2,701
720
2007
2,051
564
2008
1,034
174
2009
454
64
Culture and Food
Both cities have strong Mexican cultural influences, evident in their food and festival scenes. El Paso, being larger, has a more diverse cultural scene, while Laredo is known for its annual George Washington Birthday Celebration, a month-long event filled with festivities.
Sports Teams
Football is a big part of Texas culture, and El Paso and Laredo are no exceptions. El Paso is home to the El Paso Chihuahuas, a minor league baseball team, and the UTEP Miners college football team. Laredo has the Laredo Bucks ice hockey team and the TAMIU Dustdevils college teams.


 El Paso, TX
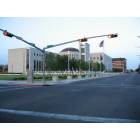
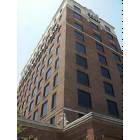
 Laredo, TX