Overview
The choice to live in either Fort Worth or Corpus Christi, Texas, represents a lifestyle decision shaped by factors such as crime and safety, weather, cost of living, and other elements unique to each city. Both cities offer unique cultural experiences brimming with Texas charm, though they distinguish themselves in terms of economic options, infrastructure, geographical conditions, and more. Let's thoroughly compare the two cities in order to facilitate your relocation or visit.
Distance between
Fort Worth, TX and
Corpus Christi, TX : 345.2 miles
Fort Worth's population is larger by 194%. Its population has grown by 400,814 people (75.0%) since 2000. The population of Corpus Christi has grown by 40,319 people (14.5%) during that time.
Fort Worth maintains slightly higher crime rates compared to the national average, with property crime being notably present although safety measures constantly improve. In Corpus Christi, the crime rates are relatively the same as Fort Worth, with a similar composition of property and violent crimes. However, each city has safe neighborhoods perfect for families and single professionals alike.
City-data.com crime index counts serious crimes and violent crime more heavily. It adjusts for the number of visitors and daily workers commuting into cities. (higher means more crime, U.S. average = 301.1)
City-data.com crime index counts serious crimes and violent crime more heavily. It adjusts for the number of visitors and daily workers commuting into cities. (higher means more crime, U.S. average = 301.1)
Sex Offenders
According to our data, there are 3,166 registered sex offenders living in Fort Worth and 1,068 registered sex offenders living in . The ratio of residents to sex offenders in Fort Worth is 270 to 1; the ratio in Corpus Christi is 305 to 1. The number of registered sex offenders compared to the number of residents in Fort Worth is near to than in Corpus Christi.
Cost of Living
Overall, Fort Worth presents a lower cost of living; groceries, healthcare, and utilities costs are notably less than the national average. Although Corpus Christi holds a relatively low cost of living, it's slightly higher than Fort Worth due to increased housing costs.
Income Tax
Texas doesn't impose an income tax, which applies consistently to residents of both Fort Worth and Corpus Christi.
Property Tax
Property tax in Fort Worth is approximately 1.99%, while Corpus Christi residents face an approximate tax rate of 1.97%.
Sales Tax
Both cities share the same sales tax rate, as determined by the state of Texas, which is 6.25%. Each city adds its own local sales tax on top, with Fort Worth at 2% and Corpus Christi at 1.75%.
Income
Type
Fort Worth
Corpus Christi
Estimated median household income
$68,235
$59,812
Estimated per capita income
$34,106
$29,969
Cost of living index (U.S. average is 100)
95.4
86.6
If you make $50,000 in Corpus Christi, you will have to make $55,081 in Fort Worth to maintain the same standard of living.
Geographical Conditions
Fort Worth has a varied landscape, with areas of flat prairie and rolling hills; it's located far from coastal regions. Corpus Christi benefits from being a coastal city, offering beautiful beaches and being a gateway to Padre Island National Seashore.
Fort Worth boasts of quality education with over 78 public schools, 21 charter schools, and 69 private schools. Corpus Christi is home to award-winning schools and is the headquarters of the Corpus Christi Independent School District.
Fort Worth has a diversified economy, heavily leaning towards education, healthcare, retail, and manufacturing. In contrast, Corpus Christi relies on oil, petrochemicals, and the Port of Corpus Christi, which is one of the largest ports in the nation.
Biggest Employers
In Fort Worth, the largest employers include American Airlines, Lockheed Martin Aeronautics and Fort Worth ISD, while in Corpus Christi, the top employers are Corpus Christi ISD, CHRISTUS Spohn Health System, and H-E-B.
There were 7,236 building permits issued in Fort Worth in 2012 (4810 more than in 2011) compared to 1,470 building permits issued in Corpus Christi in 2012 (839 more than in 2011).
In Fort Worth (Tarrant County), 41.4% voted for Democrats and 57.1% for Republicans in 2012 Presidential Election. In Corpus Christi (Nueces County), 47.6% voted for Democrats and 51.0% for Republicans.
Elections
Type
Democrats
Republicans
Other
Year
Fort Worth
Corpus Christi
Fort Worth
Corpus Christi
Fort Worth
Corpus Christi
2020
49.3%
47.9%
49.1%
50.8%
1.6%
1.4%
2016
43.2%
47.2%
51.8%
48.8%
5.0%
4.0%
2012
41.4%
47.6%
57.1%
51.0%
1.4%
1.4%
2008
43.8%
47.4%
55.5%
51.8%
0.7%
0.8%
2004
37.0%
42.6%
62.5%
56.9%
0.5%
0.4%
2000
36.9%
46.7%
60.9%
51.4%
2.3%
1.9%
1996
41.6%
53.7%
50.9%
40.2%
7.5%
6.1%
Breakdown of population affiliated with a religious congregation
Type
Adherents
Congregations
Religion
Fort Worth
Corpus Christi
Fort Worth
Corpus Christi
SOUTHERN BAPTIST CONVENTION
17.3%
10.6%
33.3%
28.6%
CATHOLIC CHURCH
11.1%
32.8%
1.9%
10.8%
MUSLIM ESTIMATE
2.2%
0.7%
0.9%
0.3%
LUTHERAN CHURCH
0.5%
0.5%
0.9%
1.7%
SEVENTH DAY ADVENTIST CHURCH
0.4%
0.2%
1.6%
0.9%
EPISCOPAL CHURCH
0.3%
0.8%
0.8%
2.0%
SALVATION ARMY
0.0%
0.5%
0.2%
0.3%
Weather
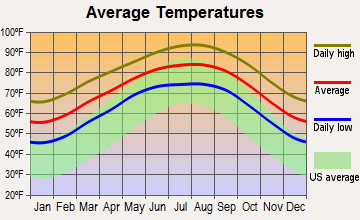
Fort Worth experiences a humid subtropical climate, with mild winters and hot summers; rainfall is well-distributed throughout the year, though special attention must be given to severe weather during tornado season. Corpus Christi enjoys a subtropical climate, with warmer winters and summers than Fort Worth. Corpus is also subject to hurricane season, which residents and visitors should be aware of.
Weather and climate
Type
Fort Worth
Corpus Christi
Temperature - Average
65°F
71.5°F
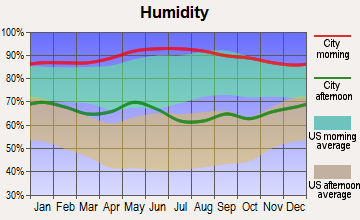
Humidity - Average morning or afternoon humidity
71.4%
81.5%
Humidity - Differences between morning and afternoon humidity
34.1%
37%
Humidity - Maximum monthly morning or afternoon humidity
82.1%
93%
Humidity - Minimum monthly morning or afternoon humidity
48%
56%
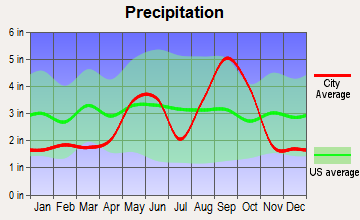
Precipitation - Yearly average
35 in
32.6 in
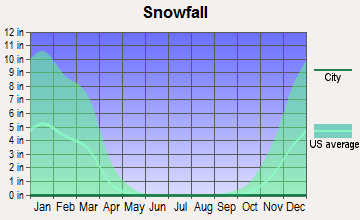
Snowfall - Yearly average
4.2 in
0.2 in
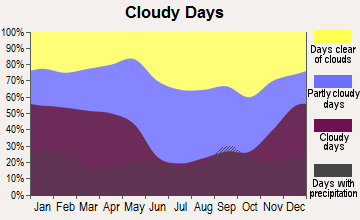
Clouds - Number of days clear of clouds
22.8%
17%
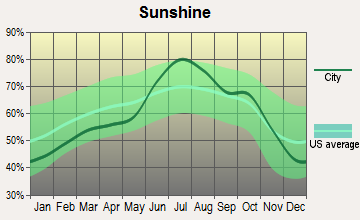
Sunshine amount - Average
66.6%
64.5%
Sunshine amount - Differences during a year
20%
36%
Sunshine amount - Maximum monthly
74%
79%
Sunshine amount - Minimum monthly
54%
43%
Wind speed - Average
10.3 mph
12.7 mph
Average climate in Fort Worth, Texas
Average climate in Corpus Christi, Texas
Air pollution
Type
AQI
CO
NO2
OZONE
PM25
SO2
Year
Fort Worth
Corpus Christi
Fort Worth
Fort Worth
Fort Worth
Corpus Christi
Fort Worth
Corpus Christi
Fort Worth
Corpus Christi
2018
67
89
N/A
N/A
5.8
N/A
27.1
23.9
N/A
9.2
N/A
0.4
2017
67
70
N/A
N/A
6.2
N/A
27.2
27.3
N/A
8.7
N/A
0.4
2016
56
59
N/A
N/A
6.3
N/A
25.5
26.9
N/A
8.1
N/A
0.5
2015
61
75
N/A
N/A
6.5
N/A
24.8
25.9
N/A
9.3
N/A
0.3
2014
56
75
0.22
N/A
6.8
N/A
26.6
26.1
N/A
9.3
N/A
0.2
2013
64
80
0.25
N/A
6.4
N/A
26.5
27.3
N/A
8.6
N/A
0.2
2012
87
78
0.26
N/A
7.8
N/A
30.3
28.6
N/A
8.9
N/A
0.2
2011
79
80
0.23
N/A
7.9
N/A
30.7
29.3
N/A
10.0
N/A
0.3
2010
70
85
0.23
N/A
8.5
N/A
27.7
27.9
N/A
9.7
N/A
0.5
2009
81
72
0.25
N/A
8.7
N/A
29.5
26.3
N/A
9.9
N/A
0.4
2008
69
82
0.25
N/A
9.6
N/A
25.8
26.4
N/A
10.0
N/A
0.6
2007
75
85
0.30
N/A
10.6
N/A
24.6
25.3
N/A
10.3
N/A
0.5
2006
90
88
0.34
N/A
10.2
N/A
29.7
27.0
N/A
10.3
N/A
0.7
2005
102
81
0.34
N/A
10.9
N/A
28.4
24.8
11.3
10.3
0.9
1.1
2004
78
74
0.39
N/A
10.6
N/A
25.4
26.8
N/A
N/A
N/A
1.3
2003
82
88
0.40
N/A
11.1
N/A
27.2
27.0
N/A
N/A
N/A
1.0
2002
94
88
0.37
N/A
11.8
N/A
25.8
27.6
N/A
N/A
N/A
0.9
2001
16
85
0.48
N/A
N/A
N/A
N/A
26.5
N/A
N/A
N/A
1.2
2000
17
78
0.55
N/A
N/A
N/A
N/A
25.8
N/A
N/A
N/A
1.3
Natural disasters
Type
Fort Worth
Corpus Christi
Tornado activity compared to U.S. average
249.6%
68.2%
Earthquake activity compared to U.S. average
562.8%
52%
Natural disasters compared to U.S. average
23%
24%
Transportation
Both cities have reliable public transportation systems. However, Fort Worth provides a broader range of options with buses, bikes, rideshares, and a train service to Dallas.
Transport
Type
Fort Worth
Corpus Christi
Amtrak stations
1
0
Amtrak stations nearby
1
0
FAA registered aircraft
2
298
FAA registered aircraft manufacturers and dealers
19
1
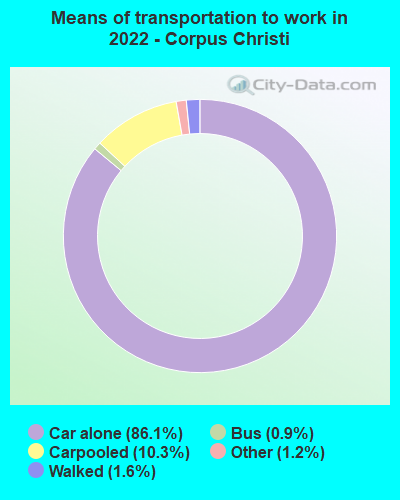
Means of transportation to work
Type
Fort Worth
Corpus Christi
Bicycle
0.1%
0.2%
Bus
0.4%
1.1%
Carpooled
11%
9.9%
Car alone
85.8%
86.5%
Motorcycle
0.1%
0.2%
Taxicab
0.1%
0.1%
Walked
1.3%
1.4%
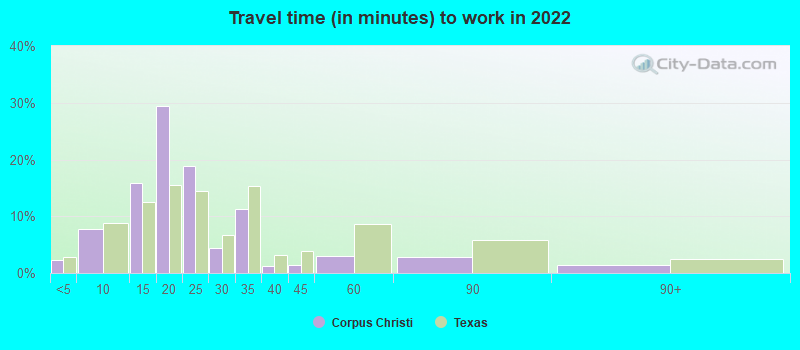
Average travel time to work
Type
Fort Worth
Corpus Christi
Average
28.5 min
21.4 min
Other means
25.3 min
20.1 min
Public transportation
41.8 min
37.6 min
Private vehicle occupancy
Type
Fort Worth
Corpus Christi
Average
1.2
1.1
Drove alone
87.6%
90.4%
In 2 person carpool
8.5%
7.6%
In 3 person carpool
2.5%
1.2%
In 4 person carpool
1.1%
0.4%
In 5-6 person carpool
0.3%
0.3%
How many people usually rode to work in the car, truck or van.
Real Estate
Fort Worth has a higher median home cost than Corpus Christi but also a higher home appreciation rate over the past decade. Corpus Christi's increasingly trendy status has led to real estate prices rising dramatically over the past few years.
Neighborhoods
Fort Worth offers neighborhoods like Westover Hills, known for its luxury, and Rivercrest with its historical charm. Corpus Christi offers neighborhoods like Mustang-Padre Island, famous for its beaches, and Calallen known for its safety and family-oriented community.
Houses and residents
Type
Fort Worth
Corpus Christi
Houses
361,341
137,431
Average household size (people)
2.8
2.7
Median year apartment built
1991
1984
Median year house/condo built
1995
1981
Length of stay in the house since moving in
11.2 years
13.3 years
Houses occupied
334,286 (92.5%)
117,366 (85.4%)
Houses occupied by owners
185,197 (55.4%)
67,874 (57.8%)
Houses occupied by renters
149,089 (44.6%)
49,492 (42.2%)
Median rent asked for vacant for-rent units
$1,068
$1,470
Median monthly housing costs
$1,328
$1,102
Median price asked for vacant for-sale houses and condos
$288,576
$329,579
Estimated median house or condo value
$249,000
$171,500
Median numbers of rooms
5.3
4.9
Median number of rooms in apartments
4.2
4.1
Median number of rooms in houses and condos
6.3
5.6
Median house price - detached houses
$279,885
$212,792
Median house price - in 2-unit structures
Over $1,000,000
$219,111
Median house price - in 3-to-4-unit structures
$337,081
$270,664
Median house price - in 5 or more unit structures
$298,062
$270,817
Median house price - mobile homes
$58,470
$33,205
Median house price - occupied boats, rvs, vans etc.
$16,069
$66,701
Median house price - Townhouses or other attached units
$279,957
$168,101
Median house price - All housing units
$279,281
$210,115
Median house age
29
40
Renting percentage
40.8%
40.7%
Housing density (houses/condos per square mile)
1,235.2
888.7
House value disparities
31.8%
37.5%
Household income disparities
43.6%
45%
Median household income for houses/condes with a mortgage
$106,170
$84,755
Median household income for apartments without a mortgage
$72,147
$55,283
Housing units without a mortgage
2,986 (2.4%)
190 (0.5%)
Housing units with both a second mortgage and home equity loan
3,696 (3%)
1,163 (3.1%)
Housing units with a mortgage
121,099 (97.6%)
37,907 (99.5%)
Housing units with a home equity loan
66 (0.1%)
0 (0%)
Housing units with a second mortgage
5,171 (4.2%)
1,292 (3.4%)
House/condo owner moved in on average (years ago)
8
11
House/condo renter moved in on average (years ago)
1
1
Housing units lacking complete kitchen facilities
1.8%
2.9%
Housing units lacking complete plumbing facilities
0.7%
2.8%
Housing units in structures
Housing units in structures
Fort Worth
Corpus Christi
One, detached
65.4%
65.0%
One, attached
2.9%
1.6%
Two
1.6%
3.0%
3 or 4
4.1%
6.5%
5 to 9
5.8%
8.7%
10 to 19
6.5%
5.7%
20 to 49
4.6%
2.3%
50 or more
7.0%
4.1%
Mobile homes
2.1%
2.8%
Boats, RVs, vans, etc.
0.0%
0.3%
Median real estate property taxes paid for housing units
Self-employed workers in own not incorporated business
27,257
10,817
State government workers
8,587
6,884
Unpaid family workers
392
230
Industries and Occupations
Fort Worth's top industries involve financial services, aeronautics, and manufacturing. Corpus Christi, on the other hand, thrives on oil refining, tourism, and healthcare.
Fort Worth houses excellent medical centers like the Baylor Scott & White All Saints Medical Center. Corpus Christi offers top-notch healthcare with facilities such as the Corpus Christi Medical Center.
Health (county statistics)
Type
Fort Worth
Corpus Christi
General health status score of residents in this county from 1 (poor) to 5 (excellent)
Both cities have well-developed infrastructures. Fort Worth, known for urban renewal projects, also offers a variety of transportation options, while Corpus Christi is recognized for its beautiful bayfront, marina, and pedestrian-friendly amenities.
Infrastructure
Type
Fort Worth
Corpus Christi
Hospitals
76
34
TV stations
25
21
Arenas or stadiums
7
1
Bank branches located here
175
83
Bank institutions located here
42
17
Main business address for public companies
24
1
Drinking water stations with no reported violations in the past
3
1
Drinking water stations with reported violations in the past
HMDA - Conventional home purchase loans - Applications denied
Year
Fort Worth
Corpus Christi
1999
3,575
1,534
2000
2,473
814
2001
2,109
738
2002
1,701
631
2003
2,183
737
2004
3,202
1,013
2005
4,261
1,275
2006
4,161
1,217
2007
2,871
942
2008
1,256
546
2009
585
413
Culture and Food
Fort Worth is known for its cowboy heritage, modern art museums, and Tex-Mex cuisine. Corpus Christi boasts a rich blend of cultural districts, beachfront dining, and locally-sourced seafood restaurants.
Sports Teams
Fort Worth doesn't have its own major league sports teams but nearby Dallas hosts teams like the Dallas Cowboys(NFL) and the Dallas Mavericks(NBA). Corpus Christi hosts the Corpus Christi Hooks, a minor league baseball team affiliated with the Houston Astros.


 Fort Worth, TX
 Corpus Christi, TX