Fort Worth, Texas and Overland Park, Kansas differ in many ways and cater to diverse lifestyles. Fort Worth, a sizeable city steeped in Western heritage, offers an urbanized setting with vibrant industries, an array of cultural experiences, and warm weather. In contrast, Overland Park offers a more suburban, tranquil atmosphere, known for its low crime rates, excellent education, and a strong economy. However, each city has its unique charm and potential for both residents and tourists alike.
Distance between
Fort Worth, TX and
Overland Park, KS : 453.4 miles
Fort Worth's population is larger by 375%. Its population has grown by 400,814 people (75.0%) since 2000. The population of Overland Park has grown by 48,026 people (32.2%) during that time.
Overland Park is considered one of the safest cities to live in Kansas and even the US. The crime rate in Overland Park is significantly lower than in Fort Worth, making it better suited for families or those seeking a peaceful environment. Fort Worth has higher crime rates consistent with those of a large city, though crime is concentrated in specific areas. Both cities have efficient law enforcement agencies responsive to the community's safety needs.
City-data.com crime index counts serious crimes and violent crime more heavily. It adjusts for the number of visitors and daily workers commuting into cities. (higher means more crime, U.S. average = 301.1)
City-data.com crime index counts serious crimes and violent crime more heavily. It adjusts for the number of visitors and daily workers commuting into cities. (higher means more crime, U.S. average = 301.1)
Sex Offenders
According to our data, there are 3,166 registered sex offenders living in Fort Worth and 132 registered sex offenders living in . The ratio of residents to sex offenders in Fort Worth is 270 to 1; the ratio in Overland Park is 1,431 to 1. The number of registered sex offenders compared to the number of residents is much larger in Fort Worth than that in Overland Park.
Cost of Living
The cost of living in Overland Park is slightly higher than the national average, primarily due to housing costs. In contrast, Fort Worth is more affordable with a cost of living below the national average, primarily due to affordable housing and lower health care costs. Utilities and groceries tend to be less costly in Fort Worth as well.
Income Tax
Texas, including Fort Worth, does not have a state income tax, which might appeal to individuals and businesses. Kansas, including Overland Park, imposes a state income tax with rates ranging from 3.1% to 5.7%.
Property Tax
Property tax rates are higher in Fort Worth than in Overland Park, which could significantly impact homeowners. However, tax benefits and property value appreciations might offset these costs.
Sales Tax
Both cities have comparable sales tax rates, with Fort Worth having an 8.25% total sales tax and Overland Park having an 8.475%. This difference may impact the overall cost of living marginally.
Income
Type
Fort Worth
Overland Park
Estimated median household income
$68,235
$89,280
Estimated per capita income
$34,106
$50,828
Cost of living index (U.S. average is 100)
95.4
88.1
If you make $50,000 in Overland Park, you will have to make $54,143 in Fort Worth to maintain the same standard of living.
Geographical Conditions
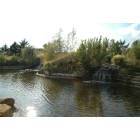
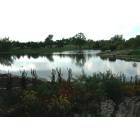
Fort Worth is located on flat Prairies and enjoys proximity to scenic public parks and lakes. Overland Park is located in the Kansas City suburban area, known for its lush green spaces and family-friendly parks.
Overland Park consistently ranks among the top places in the country regarding education, with high graduation rates and top-tier schools. Fort Worth, while having its share of excellent schools, presents a more varied picture with performance differing greatly among schools. Both cities offer several higher education opportunities including colleges and universities.
Fort Worth's economy is robust and diversified, with a strong presence in sectors like aeronautics, healthcare, and technology. Overland Park is known for its strong economy, with significant sectors including telecommunications, health care, and finance. Both cities boast robust employment markets and low unemployment rates.
Biggest Employers
In Fort Worth, the Fort Worth Independent School District, American Airlines, and Texas Health Resources are among the largest employers. Overland Park's biggest employers include Sprint, Blue Valley School District, and Shawnee Mission School District.
There were 7,236 building permits issued in Fort Worth in 2012 (4810 more than in 2011) compared to 635 building permits issued in Overland Park in 2012 (361 more than in 2011).
In Fort Worth (Tarrant County), 41.4% voted for Democrats and 57.1% for Republicans in 2012 Presidential Election. In Overland Park (Johnson County), 40.3% voted for Democrats and 57.8% for Republicans.
Elections
Type
Democrats
Republicans
Other
Year
Fort Worth
Overland Park
Fort Worth
Overland Park
Fort Worth
Overland Park
2020
49.3%
53.1%
49.1%
44.8%
1.6%
2.1%
2016
43.2%
44.1%
51.8%
46.7%
5.0%
9.1%
2012
41.4%
40.3%
57.1%
57.8%
1.4%
1.9%
2008
43.8%
44.8%
55.5%
53.8%
0.7%
1.3%
2004
37.0%
37.9%
62.5%
61.2%
0.5%
0.9%
2000
36.9%
36.4%
60.9%
59.8%
2.3%
3.7%
1996
41.6%
35.7%
50.9%
57.8%
7.5%
6.5%
Breakdown of population affiliated with a religious congregation
Type
Adherents
Congregations
Religion
Fort Worth
Overland Park
Fort Worth
Overland Park
SOUTHERN BAPTIST CONVENTION
17.3%
4.5%
33.3%
7.4%
CATHOLIC CHURCH
11.1%
18.8%
1.9%
5.1%
MUSLIM ESTIMATE
2.2%
0.5%
0.9%
0.9%
LUTHERAN CHURCH
0.5%
1.8%
0.9%
2.6%
SEVENTH DAY ADVENTIST CHURCH
0.4%
0.3%
1.6%
1.7%
EPISCOPAL CHURCH
0.3%
0.7%
0.8%
1.4%
EVANGELICAL LUTHERAN CHURCH IN AMERICA
0.3%
1.4%
0.9%
3.4%
AMERICAN BAPTIST CHURCHES IN THE USA
0.0%
0.9%
0.1%
3.7%
Weather
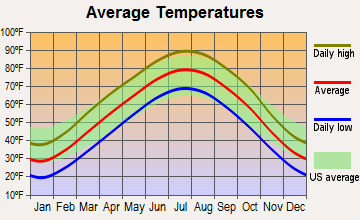
Overland Park experiences distinct four seasons with hot summers and pretty cold winters. Snowfall is common during winter, providing an idyllic setting for holidays. Fort Worth has a warmer climate characterized by hot, humid summers and mild winters. Occasionally, Fort Worth experiences extreme weather events such as hail storms and tornadoes.
Weather and climate
Type
Fort Worth
Overland Park
Temperature - Average
65°F
55.5°F
Humidity - Average morning or afternoon humidity
71.4%
76.3%
Humidity - Differences between morning and afternoon humidity
34.1%
30.4%
Humidity - Maximum monthly morning or afternoon humidity
82.1%
86.2%
Humidity - Minimum monthly morning or afternoon humidity
48%
55.7%
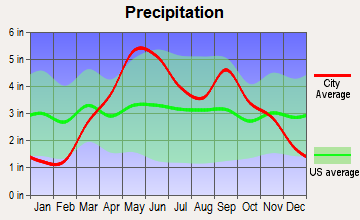
Precipitation - Yearly average
35 in
39.6 in
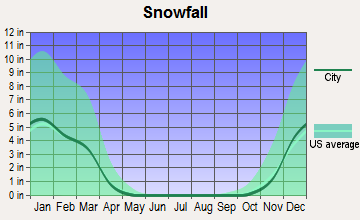
Snowfall - Yearly average
4.2 in
38.1 in
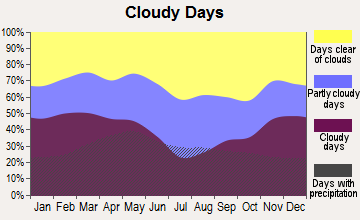
Clouds - Number of days clear of clouds
22.8%
20.1%
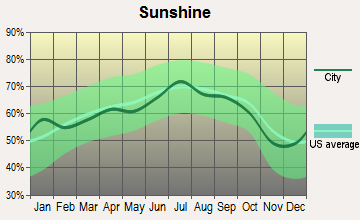
Sunshine amount - Average
66.6%
67%
Sunshine amount - Differences during a year
20%
25.7%
Sunshine amount - Maximum monthly
74%
73.8%
Sunshine amount - Minimum monthly
54%
48.2%
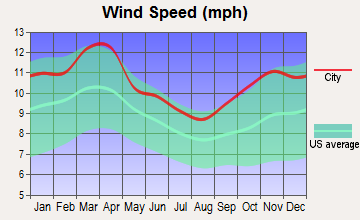
Wind speed - Average
10.3 mph
11 mph
Average climate in Fort Worth, Texas
Average climate in Overland Park, Kansas
Air pollution
Type
AQI
CO
NO2
OZONE
PM10
PM25
SO2
Year
Fort Worth
Overland Park
Fort Worth
Overland Park
Fort Worth
Overland Park
Fort Worth
Overland Park
Overland Park
Fort Worth
Overland Park
Fort Worth
Overland Park
2018
67
85
N/A
0.24
5.8
10.6
27.1
28.5
22.0
N/A
N/A
7.6
N/A
0.7
2017
67
87
N/A
0.23
6.2
10.7
27.2
29.0
22.5
N/A
N/A
7.4
N/A
1.0
2016
56
80
N/A
0.26
6.3
11.5
25.5
27.6
22.2
N/A
N/A
7.5
N/A
1.2
2015
61
89
N/A
0.29
6.5
12.2
24.8
27.9
33.6
N/A
N/A
9.3
N/A
3.0
2014
56
88
0.22
0.27
6.8
12.3
26.6
28.4
28.5
N/A
N/A
10.4
N/A
3.3
2013
64
83
0.25
0.42
6.4
12.5
26.5
30.1
30.8
N/A
N/A
10.5
N/A
3.8
2012
87
97
0.26
0.52
7.8
13.2
30.3
32.4
N/A
N/A
N/A
10.9
N/A
4.7
2011
79
97
0.23
0.45
7.9
14.0
30.7
30.2
N/A
N/A
N/A
11.3
N/A
4.2
2010
70
89
0.23
0.40
8.5
14.1
27.7
28.9
N/A
N/A
N/A
11.3
N/A
5.3
2009
81
87
0.25
0.29
8.7
13.5
29.5
27.9
N/A
N/A
N/A
9.8
N/A
5.4
2008
69
86
0.25
0.40
9.6
17.1
25.8
26.9
N/A
N/A
N/A
11.3
N/A
4.9
2007
75
92
0.30
0.42
10.6
15.9
24.6
27.8
N/A
N/A
N/A
13.1
N/A
4.2
2006
90
93
0.34
0.38
10.2
16.7
29.7
30.0
N/A
N/A
N/A
12.4
N/A
4.8
2005
102
105
0.34
0.54
10.9
17.9
28.4
29.4
N/A
N/A
11.3
N/A
0.9
4.4
2004
78
81
0.39
0.47
10.6
16.3
25.4
27.1
N/A
N/A
N/A
N/A
N/A
4.1
2003
82
95
0.40
0.43
11.1
16.8
27.2
28.2
N/A
N/A
N/A
N/A
N/A
4.0
2002
94
91
0.37
0.52
11.8
15.7
25.8
26.7
N/A
N/A
N/A
N/A
N/A
2.7
2001
16
85
0.48
0.53
N/A
16.0
N/A
26.5
N/A
N/A
N/A
N/A
N/A
1.4
2000
17
97
0.55
0.80
N/A
14.9
N/A
27.9
N/A
N/A
N/A
N/A
N/A
2.1
Natural disasters
Type
Fort Worth
Overland Park
Tornado activity compared to U.S. average
249.6%
201.8%
Earthquake activity compared to U.S. average
562.8%
619%
Natural disasters compared to U.S. average
23%
10%
Transportation
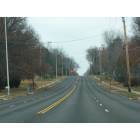
Fort Worth, being larger and denser, has a more developed public transit system provided by Trinity Metro that includes buses and a commuter rail line. Overland Park mainly relies on car commutes with public transit provided by RideKC, although routes are less widespread.
Transport
Type
Fort Worth
Overland Park
Amtrak stations
1
0
Amtrak stations nearby
1
3
FAA registered aircraft
2
201
FAA registered aircraft manufacturers and dealers
19
9
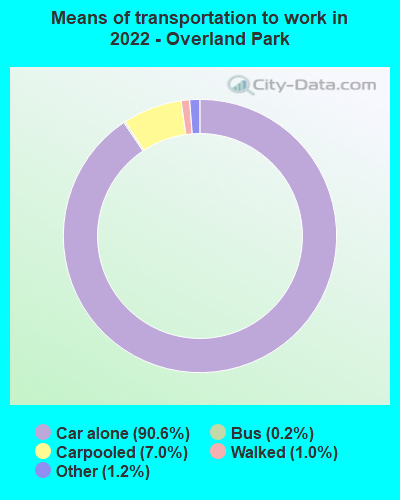
Means of transportation to work
Type
Fort Worth
Overland Park
Bicycle
0.1%
0.2%
Bus
0.4%
0.5%
Carpooled
11%
5.6%
Car alone
85.8%
90.5%
Motorcycle
0.1%
0.1%
Walked
1.3%
1.9%
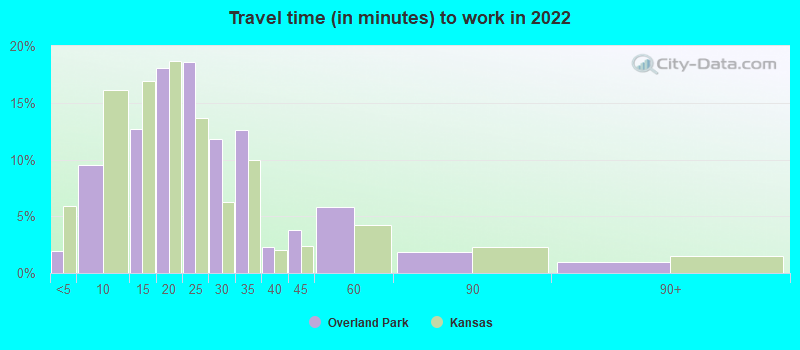
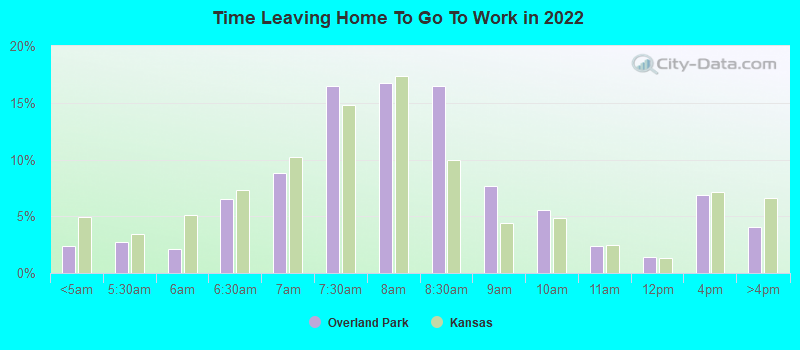
Average travel time to work
Type
Fort Worth
Overland Park
Average
28.5 min
23.5 min
Other means
25.3 min
20.4 min
Public transportation
41.8 min
33.8 min
Private vehicle occupancy
Type
Fort Worth
Overland Park
Average
1.2
1.1
Drove alone
87.6%
93.1%
In 2 person carpool
8.5%
5.3%
In 3 person carpool
2.5%
1%
In 4 person carpool
1.1%
0.2%
In 5-6 person carpool
0.3%
0.1%
In 7+ person carpool
0.1%
0.2%
How many people usually rode to work in the car, truck or van.
Real Estate
Fort Worth's booming real estate market offers an array of affordable homes to suit various budgets and lifestyles. Overland Park, however, is more costly, with home prices above the national average but offers a desirable suburban setting.
Neighborhoods
Both cities offer a mix of neighborhoods suiting different lifestyle needs. Fort Worth blends historic and modern neighborhoods, while Overland Park boasts upscale suburban neighborhoods renowned for safety and quality of life.
Houses and residents
Type
Fort Worth
Overland Park
Houses
361,341
85,708
Average household size (people)
2.8
2.4
Median year apartment built
1991
1994
Median year house/condo built
1995
1986
Length of stay in the house since moving in
11.2 years
11.8 years
Houses occupied
334,286 (92.5%)
82,593 (96.4%)
Houses occupied by owners
185,197 (55.4%)
50,359 (61%)
Houses occupied by renters
149,089 (44.6%)
32,234 (39%)
Median rent asked for vacant for-rent units
$1,068
$2,193
Median monthly housing costs
$1,328
$1,378
Median price asked for vacant for-sale houses and condos
$288,576
$298,188
Estimated median house or condo value
$249,000
$352,000
Median numbers of rooms
5.3
6.2
Median number of rooms in apartments
4.2
3.7
Median number of rooms in houses and condos
6.3
7.9
Median house price - detached houses
$279,885
$369,400
Median house price - in 2-unit structures
Over $1,000,000
$192,477
Median house price - in 3-to-4-unit structures
$337,081
$187,166
Median house price - in 5 or more unit structures
$298,062
$237,623
Median house price - mobile homes
$58,470
$162,267
Median house price - Townhouses or other attached units
$279,957
$246,600
Median house price - All housing units
$279,281
$355,351
Median house age
29
32
Renting percentage
40.8%
34.8%
Housing density (houses/condos per square mile)
1,235.2
1,510.3
House value disparities
31.8%
28.5%
Household income disparities
43.6%
40.2%
Median household income for houses/condes with a mortgage
$106,170
$137,694
Median household income for apartments without a mortgage
$72,147
$88,940
Housing units without a mortgage
2,986 (2.4%)
641 (1.9%)
Housing units with both a second mortgage and home equity loan
3,696 (3%)
3,500 (10.3%)
Housing units with a mortgage
121,099 (97.6%)
33,381 (98.1%)
Housing units with a home equity loan
66 (0.1%)
134 (0.4%)
Housing units with a second mortgage
5,171 (4.2%)
3,937 (11.6%)
House/condo owner moved in on average (years ago)
8
9
House/condo renter moved in on average (years ago)
1
1
Housing units lacking complete kitchen facilities
1.8%
1.1%
Housing units lacking complete plumbing facilities
0.7%
0.1%
Housing units in structures
Housing units in structures
Fort Worth
Overland Park
One, detached
65.4%
56.8%
One, attached
2.9%
7.6%
Two
1.6%
1.4%
3 or 4
4.1%
8.1%
5 to 9
5.8%
10.7%
10 to 19
6.5%
5.7%
20 to 49
4.6%
2.6%
50 or more
7.0%
6.5%
Mobile homes
2.1%
0.5%
Median real estate property taxes paid for housing units
Self-employed workers in own not incorporated business
27,257
6,111
State government workers
8,587
4,203
Unpaid family workers
392
0
Industries and Occupations
Fort Worth is home to the headquarters of prominent companies like American Airlines, Lockheed Martin, and Pier 1 Imports, creating opportunities in aeronautics, retail, and transportation. Overland Park is heavily influenced by telecommunications, finance, and healthcare, hosting companies like Sprint and the financial giant Black & Veatch.
Both cities deliver excellent healthcare services, but Fort Worth is home to large healthcare employers and several highly ranked hospitals. Overland Park, with its smaller population, still has highly rated health care facilities rated among the top in the nation.
Health (county statistics)
Type
Fort Worth
Overland Park
General health status score of residents in this county from 1 (poor) to 5 (excellent)
Both Fort Worth and Overland Park have substantial infrastructure. Fort Worth, being the larger city, has a more developed urban infrastructure with numerous highways, airports and railway connections. Overland Park, despite its smaller size, boasts well-maintained roads, open spaces and recreational facilities.
HMDA - Conventional home purchase loans - Applications denied
Year
Fort Worth
Overland Park
1999
3,575
257
2000
2,473
142
2001
2,109
106
2002
1,701
122
2003
2,183
292
2004
3,202
394
2005
4,261
425
2006
4,161
380
2007
2,871
265
2008
1,256
140
2009
585
78
Culture and Food
Fort Worth shines in terms of culture, from its Western heritage to its vibrant arts scene. Food-wise, Texas BBQ and Tex-Mex are local favorites. Overland Park, while quieter, boasts excellent cultural amenities like theaters and galleries, and its food scene offers a farm-to-table approach with an emphasis on fresh, local ingredients.
Sports Teams
Fort Worth sits within the Dallas-Fort Worth metroplex, home to several major sports franchises like the Dallas Cowboys, Texas Rangers, and Dallas Mavericks. Overland Park, while not having any major league teams, has enthusiastic sports suburban culture, with Kansas City's professional sports teams within easy reach.


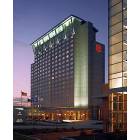
 Fort Worth, TX
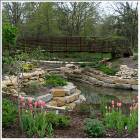
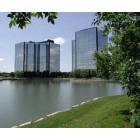
 Overland Park, KS