Ft. Worth, Texas, and Toledo, Ohio offer unique experiences shaped by contrasting geographical locations and cultural practices. Comparing these two cities involves reviewing significant areas such as crime and safety, weather, cost of living, education, work and economy, infrastructure, and several other factors. It is essential to understand these aspects to make an informed decision about living, working, or touring these cities.
Distance between
Fort Worth, TX and
Toledo, OH : 974.4 miles
Fort Worth's population is larger by 248%. Its population has grown by 400,814 people (75.0%) since 2000. The population of Toledo has decreased by 45,111 people (14.4%) during that time.
With regard to safety, both Toledo, OH, and Fort Worth, TX have crime rates higher than the national average. However, Ft. Worth's crime rate is generally lower than Toledo's. Specifically, Fort Worth's violent crime rate is nearly half of Toledo's rate. For individuals concerned about safety, Fort Worth might be an ideal choice. For tourists, visiting safer neighborhoods and being vigilant can generally lead to a safe visit in either city.
City-data.com crime index counts serious crimes and violent crime more heavily. It adjusts for the number of visitors and daily workers commuting into cities. (higher means more crime, U.S. average = 301.1)
City-data.com crime index counts serious crimes and violent crime more heavily. It adjusts for the number of visitors and daily workers commuting into cities. (higher means more crime, U.S. average = 301.1)
Sex Offenders
According to our data, there are 3,166 registered sex offenders living in Fort Worth and 850 registered sex offenders living in . The ratio of residents to sex offenders in Fort Worth is 270 to 1; the ratio in Toledo is 328 to 1. The number of registered sex offenders compared to the number of residents in Fort Worth is near to than in Toledo.
Cost of Living
The cost of living in Fort Worth is slightly higher than in Toledo. However, it’s worth noting that Fort Worth has a stronger job market, and average salaries are also higher compared to Toledo. So, while you might pay more in living expenses in Fort Worth, you also have an opportunity to earn more.
Income Tax
Texas, including Fort Worth, does not have an state income tax. In contrast, Ohio does have a state income tax, with rates ranging from 2.85% to 4.797%, depending on income level.
Property Tax
Property taxes in Texas are quite high compared to other states, so homeowners in Fort Worth will face higher property taxes than those in Toledo.
Sales Tax
As far as taxes are concerned, Texas doesn't have a state income tax, which can potentially put more money in residents' pockets. Ohio, however, does have a state income tax. The sales tax in Fort Worth is 8.25% while the sales tax in Toledo is 7.25%.
Income
Type
Fort Worth
Toledo
Estimated median household income
$68,235
$44,150
Estimated per capita income
$34,106
$25,641
Cost of living index (U.S. average is 100)
95.4
91.8
If you make $50,000 in Toledo, you will have to make $51,961 in Fort Worth to maintain the same standard of living.
Geographical Conditions
Fort Worth is situated in the humid subtropical region and is known for its hot, humid summers and mild winters. On the other hand, Toledo, located on the western edge of Lake Erie, witnesses cold winters and humid summers.
Both cities have a number of educational institutions. However, Fort Worth benefits from its proximity to Dallas and access to more than 35 colleges and universities within the metro area, including Texas Christian University and Tarrant County College in Fort Worth itself. Toledo also offers a range of options, being home to the University of Toledo and several community colleges, but doesn't quite match the volume or prestige of the schools available in the Dallas-Fort Worth area.
Fort Worth's economy is diverse, with industries including aviation, healthcare, and technology. On the other hand, Toledo has a concentration of jobs in the manufacturing sector, particularly in car manufacturing. However, Fort Worth tends to offer a wider variety of job opportunities, as well as higher average salaries.
Biggest Employers
Fort Worth's top employers include American Airlines, Lockheed Martin, and the Naval Air Station Joint Reserve Base. In Toledo, on the other hand, the biggest employers are Promedica, the University of Toledo, and the Jeep division of Fiat Chrysler Automobiles.
There were 7,236 building permits issued in Fort Worth in 2012 (4810 more than in 2011) compared to 23 building permits issued in Toledo in 2012 (10 less than in 2011).
In Fort Worth (Tarrant County), 41.4% voted for Democrats and 57.1% for Republicans in 2012 Presidential Election. In Toledo (Lucas County), 65.2% voted for Democrats and 33.4% for Republicans.
Elections
Type
Democrats
Republicans
Other
Year
Fort Worth
Toledo
Fort Worth
Toledo
Fort Worth
Toledo
2020
49.3%
57.5%
49.1%
40.8%
1.6%
1.7%
2016
43.2%
55.9%
51.8%
38.2%
5.0%
5.9%
2012
41.4%
65.2%
57.1%
33.4%
1.4%
1.4%
2008
43.8%
65.1%
55.5%
33.6%
0.7%
1.4%
2004
37.0%
60.4%
62.5%
39.6%
0.5%
0.0%
2000
36.9%
57.9%
60.9%
39.2%
2.3%
2.8%
1996
41.6%
57.7%
50.9%
32.0%
7.5%
10.3%
Breakdown of population affiliated with a religious congregation
Type
Adherents
Congregations
Religion
Fort Worth
Toledo
Fort Worth
Toledo
SOUTHERN BAPTIST CONVENTION
17.3%
0.3%
33.3%
3.5%
CATHOLIC CHURCH
11.1%
20.9%
1.9%
9.4%
MUSLIM ESTIMATE
2.2%
0.4%
0.9%
0.8%
LUTHERAN CHURCH
0.5%
0.7%
0.9%
2.7%
SEVENTH DAY ADVENTIST CHURCH
0.4%
0.2%
1.6%
0.5%
EPISCOPAL CHURCH
0.3%
0.5%
0.8%
2.2%
EVANGELICAL LUTHERAN CHURCH IN AMERICA
0.3%
4.1%
0.9%
9.1%
AMERICAN BAPTIST CHURCHES IN THE USA
0.0%
0.5%
0.1%
3.2%
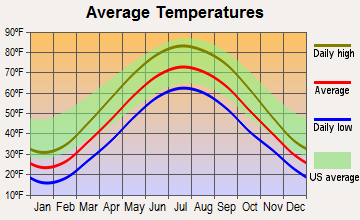
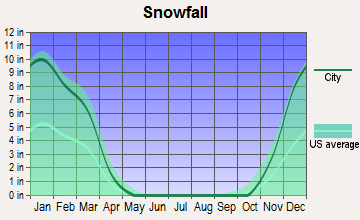
Weather
The weather greatly differs in these two areas. Fort Worth generally enjoys warmer weather, with hot summers and mild winters. Toledo, on the other hand, experiences cold winters and humid, warm summers. Toledo also gets more rain and snow compared to Fort Worth. Tourists and potential residents should consider their preference for weather while choosing between these cities.
Weather and climate
Type
Fort Worth
Toledo
Temperature - Average
65°F
49.2°F
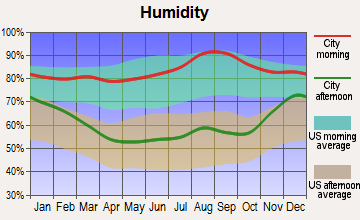
Humidity - Average morning or afternoon humidity
71.4%
76.9%
Humidity - Differences between morning and afternoon humidity
34.1%
37%
Humidity - Maximum monthly morning or afternoon humidity
82.1%
89%
Humidity - Minimum monthly morning or afternoon humidity
48%
52%
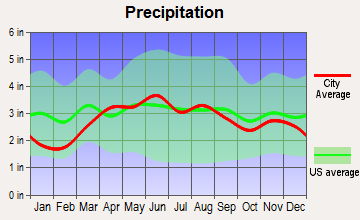
Precipitation - Yearly average
35 in
33.3 in
Snowfall - Yearly average
4.2 in
75.3 in
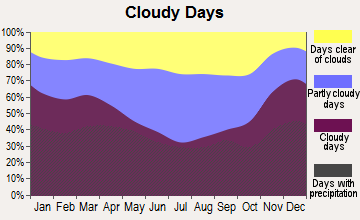
Clouds - Number of days clear of clouds
22.8%
12.3%
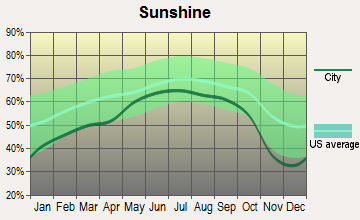
Sunshine amount - Average
66.6%
55.1%
Sunshine amount - Differences during a year
20%
36%
Sunshine amount - Maximum monthly
74%
65%
Sunshine amount - Minimum monthly
54%
29%
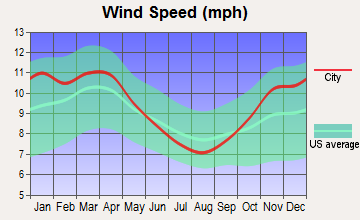
Wind speed - Average
10.3 mph
9.4 mph
Average climate in Fort Worth, Texas
Average climate in Toledo, Ohio
Air pollution
Type
AQI
CO
NO2
OZONE
PM10
PM25
SO2
Year
Fort Worth
Toledo
Fort Worth
Fort Worth
Fort Worth
Toledo
Toledo
Fort Worth
Fort Worth
Toledo
2018
67
47
N/A
N/A
5.8
N/A
27.1
30.1
N/A
N/A
N/A
N/A
N/A
0.7
2017
67
45
N/A
N/A
6.2
N/A
27.2
29.0
N/A
N/A
N/A
N/A
N/A
0.4
2016
56
50
N/A
N/A
6.3
N/A
25.5
29.9
N/A
N/A
N/A
N/A
N/A
0.5
2015
61
45
N/A
N/A
6.5
N/A
24.8
28.7
N/A
N/A
N/A
N/A
N/A
0.9
2014
56
50
0.22
N/A
6.8
N/A
26.6
28.8
N/A
N/A
N/A
N/A
N/A
1.7
2013
64
40
0.25
N/A
6.4
N/A
26.5
25.2
N/A
N/A
N/A
N/A
N/A
1.0
2012
87
84
0.26
N/A
7.8
N/A
30.3
30.6
23.5
N/A
N/A
N/A
N/A
N/A
2011
79
65
0.23
N/A
7.9
N/A
30.7
25.7
21.0
N/A
N/A
N/A
N/A
N/A
2010
70
69
0.23
N/A
8.5
N/A
27.7
27.2
24.6
N/A
N/A
N/A
N/A
N/A
2009
81
64
0.25
N/A
8.7
N/A
29.5
25.4
21.4
N/A
N/A
N/A
N/A
N/A
2008
69
68
0.25
N/A
9.6
N/A
25.8
26.8
21.6
N/A
N/A
N/A
N/A
N/A
2007
75
86
0.30
N/A
10.6
N/A
24.6
25.9
24.2
N/A
N/A
N/A
N/A
3.8
2006
90
70
0.34
N/A
10.2
N/A
29.7
24.7
22.8
N/A
N/A
N/A
N/A
3.7
2005
102
84
0.34
N/A
10.9
N/A
28.4
27.8
21.6
N/A
11.3
N/A
0.9
5.1
2004
78
67
0.39
N/A
10.6
N/A
25.4
23.6
19.2
N/A
N/A
N/A
N/A
5.6
2003
82
77
0.40
N/A
11.1
N/A
27.2
26.0
18.5
N/A
N/A
N/A
N/A
6.5
2002
94
85
0.37
N/A
11.8
N/A
25.8
27.5
23.5
N/A
N/A
N/A
N/A
5.7
2001
16
76
0.48
N/A
N/A
N/A
N/A
26.9
23.4
N/A
N/A
N/A
N/A
5.3
2000
17
64
0.55
N/A
N/A
N/A
N/A
24.0
23.4
N/A
N/A
N/A
N/A
4.2
Natural disasters
Type
Fort Worth
Toledo
Tornado activity compared to U.S. average
249.6%
144.4%
Earthquake activity compared to U.S. average
562.8%
67.7%
Natural disasters compared to U.S. average
23%
13%
Transportation
Commute times in Fort Worth are longer, due to the larger geographical area and higher population density. On the other hand, Toledo offers shorter average commute times. Public transit systems exist in both cities, but Fort Worth's service is more extensive.
Transport
Type
Fort Worth
Toledo
Amtrak stations
1
1
Amtrak stations nearby
1
1
FAA registered aircraft
2
102
FAA registered aircraft manufacturers and dealers
19
7
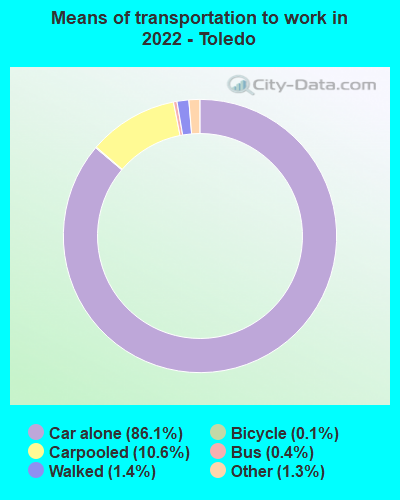
Means of transportation to work
Type
Fort Worth
Toledo
Bicycle
0.1%
0.2%
Bus
0.4%
1.1%
Carpooled
11%
9.2%
Car alone
85.8%
85.7%
Motorcycle
0.1%
0.1%
Taxicab
0.1%
0.2%
Walked
1.3%
2.2%
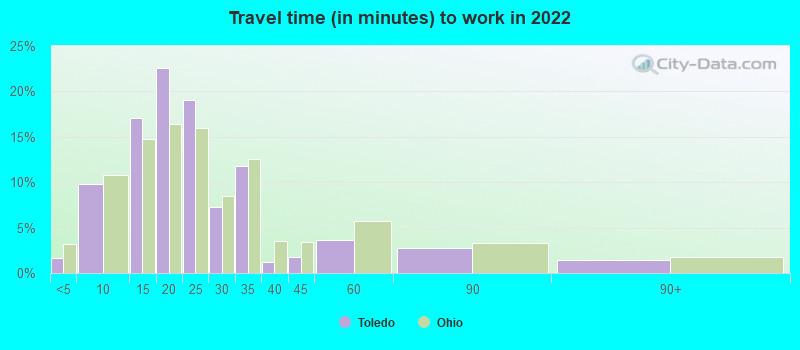
Average travel time to work
Type
Fort Worth
Toledo
Average
28.5 min
22.9 min
Other means
25.3 min
20.4 min
Public transportation
41.8 min
37.9 min
Private vehicle occupancy
Type
Fort Worth
Toledo
Average
1.2
1.1
Drove alone
87.6%
88.6%
In 2 person carpool
8.5%
9.9%
In 3 person carpool
2.5%
0.6%
In 4 person carpool
1.1%
0.6%
In 5-6 person carpool
0.3%
0.2%
In 7+ person carpool
0.1%
0.1%
How many people usually rode to work in the car, truck or van.
Real Estate
In general, housing costs are higher in Fort Worth than in Toledo, aligning with the higher cost of living in Texas. However, there are various types of housing available in both cities, from apartments to houses, catering to all preferences.
Neighborhoods
Both Fort Worth and Toledo have a diverse range of neighborhoods to suit different tastes. Fort Worth has a number of suburban neighborhoods, while Toledo provides a mixture of urban and suburban living.
Houses and residents
Type
Fort Worth
Toledo
Houses
361,341
133,129
Average household size (people)
2.8
2.3
Median year apartment built
1991
1967
Median year house/condo built
1995
1953
Length of stay in the house since moving in
11.2 years
15.4 years
Houses occupied
334,286 (92.5%)
120,895 (90.8%)
Houses occupied by owners
185,197 (55.4%)
67,831 (56.1%)
Houses occupied by renters
149,089 (44.6%)
53,064 (43.9%)
Median rent asked for vacant for-rent units
$1,068
$666.64
Median monthly housing costs
$1,328
$752
Median price asked for vacant for-sale houses and condos
$288,576
$77,176
Estimated median house or condo value
$249,000
$100,100
Median numbers of rooms
5.3
5.7
Median number of rooms in apartments
4.2
4.5
Median number of rooms in houses and condos
6.3
6.4
Median house price - detached houses
$279,885
$114,880
Median house price - in 2-unit structures
Over $1,000,000
$106,468
Median house price - in 3-to-4-unit structures
$337,081
$56,240
Median house price - in 5 or more unit structures
$298,062
$108,374
Median house price - mobile homes
$58,470
$141,902
Median house price - Townhouses or other attached units
$279,957
$127,839
Median house price - All housing units
$279,281
$114,763
Median house age
29
65
Renting percentage
40.8%
44.5%
Housing density (houses/condos per square mile)
1,235.2
1,651.3
House value disparities
31.8%
38.9%
Household income disparities
43.6%
45.1%
Median household income for houses/condes with a mortgage
$106,170
$70,155
Median household income for apartments without a mortgage
$72,147
$46,019
Housing units without a mortgage
2,986 (2.4%)
1,756 (4.5%)
Housing units with both a second mortgage and home equity loan
3,696 (3%)
2,444 (6.2%)
Housing units with a mortgage
121,099 (97.6%)
37,635 (95.5%)
Housing units with a home equity loan
66 (0.1%)
70 (0.2%)
Housing units with a second mortgage
5,171 (4.2%)
3,377 (8.6%)
House/condo owner moved in on average (years ago)
8
15
House/condo renter moved in on average (years ago)
1
3
Housing units lacking complete kitchen facilities
1.8%
4.1%
Housing units lacking complete plumbing facilities
0.7%
4.3%
Housing units in structures
Housing units in structures
Fort Worth
Toledo
One, detached
65.4%
66.3%
One, attached
2.9%
3.4%
Two
1.6%
5.0%
3 or 4
4.1%
4.7%
5 to 9
5.8%
5.2%
10 to 19
6.5%
4.9%
20 to 49
4.6%
3.1%
50 or more
7.0%
5.4%
Mobile homes
2.1%
2.0%
Median real estate property taxes paid for housing units
Self-employed workers in own not incorporated business
27,257
5,059
State government workers
8,587
3,238
Unpaid family workers
392
91
Industries and Occupations
Ft. Worth is known for its aviation, education, and healthcare sectors, while Toledo's economy is based predominantly on manufacturing and healthcare. Both cities provide diverse employment options in growing sectors, but Ft. Worth's larger economy and broader array of sectors may present more opportunities for job seekers.
Fort Worth offers a wide range of healthcare services, including some highly-rated hospitals like the Baylor Scott & White All Saints Medical Center. Toledo also has some good healthcare facilities, including the ProMedica Toledo Hospital, which is recognized nationally for its high-quality care.
Health (county statistics)
Type
Fort Worth
Toledo
General health status score of residents in this county from 1 (poor) to 5 (excellent)
Both Fort Worth and Toledo have robust infrastructures. Fort Worth benefits from its location in the bustling Dallas-Fort Worth metroplex, offering a diverse range of amenities and resources. Toledo, though smaller, also offers a developed infrastructure, with various amenities and a solid transportation network.
Infrastructure
Type
Fort Worth
Toledo
Hospitals
76
18
TV stations
25
12
Arenas or stadiums
7
2
Bank branches located here
175
77
Bank institutions located here
42
11
Main business address for public companies
24
9
Drinking water stations with no reported violations in the past
3
10
Drinking water stations with reported violations in the past
HMDA - Conventional home purchase loans - Applications denied
Year
Fort Worth
Toledo
1999
3,575
1,192
2000
2,473
1,302
2001
2,109
1,034
2002
1,701
719
2003
2,183
841
2004
3,202
1,086
2005
4,261
1,399
2006
4,161
1,229
2007
2,871
767
2008
1,256
408
2009
585
149
Culture and Food
Both cities are rich in cultural offerings. Fort Worth is known for its western heritage, while Toledo showcases a blend of cultures, owing to its diverse population. Fort Worth boasts a notable art scene, with major museums like the Kimbell Art Museum. Toledo is home to the Toledo Museum of Art and a major jazz festival. In terms of food, both cities offer a mix of local and international cuisines.
Sports Teams
There are more professional sports team in Fort Worth, thanks to its metro connection with Dallas, home to the Mavericks (NBA), the Cowboys (NFL), and the Rangers (MLB). Toledo, while not having major league teams, fosters a strong sports culture with minor league teams such as the Toledo Mud Hens (MiLB) and Toledo Walleye (ECHL).


 Fort Worth, TX
 Toledo, OH