Indianapolis, Indiana, and Corpus Christi, Texas, are two unique American cities with distinct cultures, economies, and environments. The former is known for its thriving industries and vibrant sports culture, while the latter is renowned for its beautiful coastal location and laid-back atmosphere. The following comparison considers aspects critical to both potential residents and tourists, including crime rates, cost of living, and local culture.
Distance between
Indianapolis, IN and
Corpus Christi, TX : 1,052.0 miles
Indianapolis's population is larger by 178%. Its population has grown by 100,169 people (12.8%) since 2000. The population of Corpus Christi has grown by 40,319 people (14.5%) during that time.
Both cities do somewhat struggle with crime. In terms of overall crime rates, Indianapolis reports higher levels compared to Corpus Christi. This is something that residents, potential movers, and tourists should keep in mind when considering personal safety. Though crime is a concern in both cities, active community policing efforts are in place with the aim of improving safety conditions.
City-data.com crime index counts serious crimes and violent crime more heavily. It adjusts for the number of visitors and daily workers commuting into cities. (higher means more crime, U.S. average = 301.1)
City-data.com crime index counts serious crimes and violent crime more heavily. It adjusts for the number of visitors and daily workers commuting into cities. (higher means more crime, U.S. average = 301.1)
Sex Offenders
According to our data, there are 81 registered sex offenders living in Indianapolis and 1,070 registered sex offenders living in . The ratio of residents to sex offenders in Indianapolis is 10,525 to 1; the ratio in Corpus Christi is 304 to 1. The number of registered sex offenders compared to the number of residents is a lot smaller in Indianapolis than in Corpus Christi.
Cost of Living
Overall, the cost of living is comparatively lower in Indianapolis than in Corpus Christi. This includes healthcare, housing, and groceries. However, Corpus Christi does have a slight advantage when it comes to transportation costs.
Income Tax
Indiana has a flat state income tax rate of 3.23%. In contrast, Texas does not impose a state income tax.
Property Tax
Indianapolis, Indiana's average county property tax rate is about 0.85%, while Corpus Christi, Texas has a significantly higher property tax rate, averaging around 1.94%.
Sales Tax
Indiana has a flat state sales tax of 7%, while Texas does not have a state sales tax and instead, Corpus Christi imposes a combined local sales tax rate of 8.25%.
Income
Type
Indianapolis
Corpus Christi
Estimated median household income
$58,479
$59,812
Estimated per capita income
$32,792
$29,969
Cost of living index (U.S. average is 100)
87.7
86.6
If you make $50,000 in Corpus Christi, you will have to make $50,635 in Indianapolis to maintain the same standard of living.
Geographical Conditions
Indianapolis, in the Midwestern U.S., has a flat topography with several parks and green spaces. Corpus Christi, located on Texas’s Gulf Coast, offers beautiful beachfront and ocean views.
Indianapolis is home to several high-ranking educational institutions including Butler University and Indiana University-Purdue University Indianapolis. Corpus Christi also offers quality education, with Texas A&M University-Corpus Christi being a notable institution. Both cities have public and private school options for K-12 education.
Indianapolis has a slightly more diversified and robust economy compared to Corpus Christi. The city boasts a thriving healthcare sector, manufacturing, and retail. Meanwhile, Corpus Christi’s economy leans heavily towards the energy, defense, and tourism sectors.
Biggest Employers
The top employers in Indianapolis include Indiana University Health and Eli Lilly and Company. In Corpus Christi, CHRISTUS Spohn Health System and the Corpus Christi Independent School District are top employers.
There were 1,221 building permits issued in Indianapolis in 2012 (704 more than in 2011) compared to 1,470 building permits issued in Corpus Christi in 2012 (839 more than in 2011).
In Indianapolis (Marion County), 60.1% voted for Democrats and 37.9% for Republicans in 2012 Presidential Election. In Corpus Christi (Nueces County), 47.6% voted for Democrats and 51.0% for Republicans.
Elections
Type
Democrats
Republicans
Other
Year
Indianapolis
Corpus Christi
Indianapolis
Corpus Christi
Indianapolis
Corpus Christi
2020
63.7%
47.9%
34.5%
50.8%
1.9%
1.4%
2016
58.2%
47.2%
35.6%
48.8%
6.2%
4.0%
2012
60.1%
47.6%
37.9%
51.0%
2.0%
1.4%
2008
63.8%
47.4%
35.4%
51.8%
0.8%
0.8%
2004
50.6%
42.6%
48.7%
56.9%
0.7%
0.4%
2000
48.0%
46.7%
49.3%
51.4%
2.8%
1.9%
1996
44.6%
53.7%
47.8%
40.2%
7.7%
6.1%
Breakdown of population affiliated with a religious congregation
Type
Adherents
Congregations
Religion
Indianapolis
Corpus Christi
Indianapolis
Corpus Christi
CATHOLIC CHURCH
11.1%
32.8%
4.6%
10.8%
SOUTHERN BAPTIST CONVENTION
1.6%
10.6%
5.7%
28.6%
AMERICAN BAPTIST CHURCHES IN THE USA
1.2%
0.0%
3.4%
0.0%
LUTHERAN CHURCH
0.8%
0.5%
1.5%
1.7%
EVANGELICAL LUTHERAN CHURCH IN AMERICA
0.5%
0.3%
1.6%
1.1%
SEVENTH DAY ADVENTIST CHURCH
0.5%
0.2%
1.6%
0.9%
EPISCOPAL CHURCH
0.4%
0.8%
1.1%
2.0%
MUSLIM ESTIMATE
0.3%
0.7%
1.1%
0.3%
SALVATION ARMY
0.3%
0.5%
0.3%
0.3%
Weather
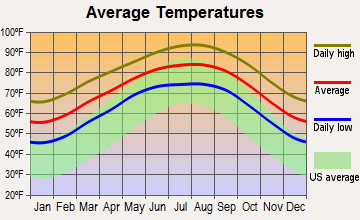
Weather is a significant point of divergence between these two cities. Indianapolis has a humid continental climate, with hot, humid summers and potentially severe winters, which may require some adjustment for new residents. Corpus Christi, being on the Gulf Coast, experiences a humid subtropical climate with mild winters and hot, humid summers, which is more appealing to those who prefer year-round warmth.
Weather and climate
Type
Indianapolis
Corpus Christi
Temperature - Average
52.1°F
71.5°F
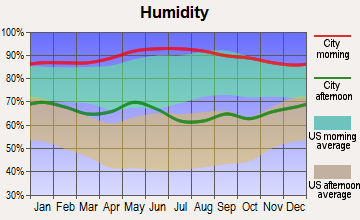
Humidity - Average morning or afternoon humidity
77%
81.5%
Humidity - Differences between morning and afternoon humidity
31%
37%
Humidity - Maximum monthly morning or afternoon humidity
86%
93%
Humidity - Minimum monthly morning or afternoon humidity
55%
56%
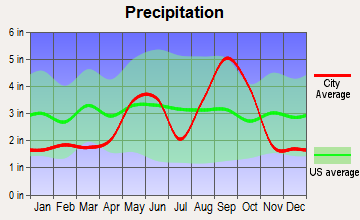
Precipitation - Yearly average
40.6 in
32.6 in
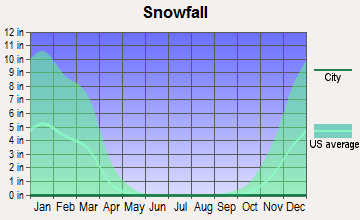
Snowfall - Yearly average
51 in
0.2 in
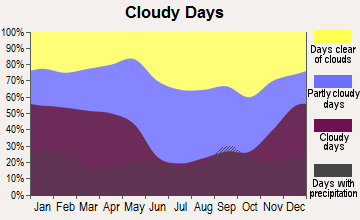
Clouds - Number of days clear of clouds
14.7%
17%
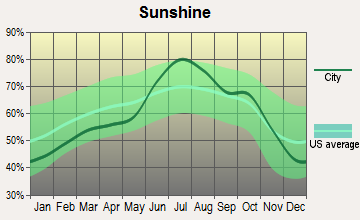
Sunshine amount - Average
56.2%
64.5%
Sunshine amount - Differences during a year
33%
36%
Sunshine amount - Maximum monthly
65%
79%
Sunshine amount - Minimum monthly
32%
43%
Wind speed - Average
10.3 mph
12.7 mph
Average climate in Indianapolis, Indiana
Average climate in Corpus Christi, Texas
Air pollution
Type
AQI
CO
NO2
OZONE
PB
PM10
PM25
SO2
Year
Indianapolis
Corpus Christi
Indianapolis
Indianapolis
Indianapolis
Corpus Christi
Indianapolis
Indianapolis
Indianapolis
Corpus Christi
Indianapolis
Corpus Christi
2018
94
89
0.58
N/A
13.2
N/A
23.1
23.9
N/A
N/A
18.2
N/A
10.4
9.2
0.3
0.4
2017
87
70
0.82
N/A
12.4
N/A
23.0
27.3
N/A
N/A
17.6
N/A
10.1
8.7
0.4
0.4
2016
91
59
0.62
N/A
13.0
N/A
22.5
26.9
N/A
N/A
18.0
N/A
9.9
8.1
0.4
0.5
2015
89
75
0.73
N/A
14.9
N/A
22.9
25.9
N/A
N/A
19.7
N/A
9.9
9.3
1.1
0.3
2014
100
75
0.62
N/A
16.1
N/A
25.1
26.1
N/A
N/A
20.6
N/A
12.1
9.3
3.2
0.2
2013
94
80
0.69
N/A
11.5
N/A
26.3
27.3
N/A
N/A
19.9
N/A
12.8
8.6
2.6
0.2
2012
103
78
0.65
N/A
10.4
N/A
25.7
28.6
N/A
N/A
20.8
N/A
12.9
8.9
2.9
0.2
2011
105
80
0.68
N/A
11.3
N/A
22.9
29.3
N/A
N/A
N/A
N/A
16.3
10.0
2.4
0.3
2010
101
85
0.54
N/A
12.7
N/A
21.6
27.9
N/A
N/A
N/A
N/A
15.9
9.7
3.3
0.5
2009
97
72
0.73
N/A
11.4
N/A
23.2
26.3
N/A
N/A
N/A
N/A
13.8
9.9
1.9
0.4
2008
91
82
0.62
N/A
11.5
N/A
N/A
26.4
0.010
N/A
N/A
N/A
13.2
10.0
3.0
0.6
2007
103
85
0.69
N/A
13.1
N/A
N/A
25.3
0.011
N/A
N/A
N/A
14.9
10.3
3.6
0.5
2006
95
88
0.59
N/A
14.5
N/A
N/A
27.0
0.009
N/A
N/A
N/A
14.5
10.3
3.6
0.7
2005
121
81
0.65
N/A
15.2
N/A
N/A
24.8
0.014
N/A
N/A
N/A
18.0
10.3
4.3
1.1
2004
104
74
0.62
N/A
15.8
N/A
N/A
26.8
0.010
N/A
N/A
N/A
15.1
N/A
4.6
1.3
2003
113
88
0.67
N/A
16.6
N/A
N/A
27.0
0.010
N/A
N/A
N/A
15.8
N/A
4.2
1.0
2002
125
88
0.76
N/A
17.4
N/A
N/A
27.6
0.009
N/A
N/A
N/A
16.8
N/A
3.9
0.9
2001
105
85
0.81
N/A
16.6
N/A
N/A
26.5
0.031
N/A
N/A
N/A
16.3
N/A
3.8
1.2
2000
98
78
0.87
N/A
17.3
N/A
N/A
25.8
N/A
N/A
N/A
N/A
N/A
N/A
4.5
1.3
Natural disasters
Type
Indianapolis
Corpus Christi
Tornado activity compared to U.S. average
226.7%
68.2%
Earthquake activity compared to U.S. average
179.6%
52%
Natural disasters compared to U.S. average
16%
24%
Transportation
Indianapolis has a well-established bus system run by IndyGo and offers citywide bike-sharing programs. Corpus Christi also provides a public bus service but has less extensive options for alternative modes of transport.
Transport
Type
Indianapolis
Corpus Christi
Amtrak stations
1
0
Amtrak stations nearby
1
0
FAA registered aircraft
739
298
FAA registered aircraft manufacturers and dealers
18
1
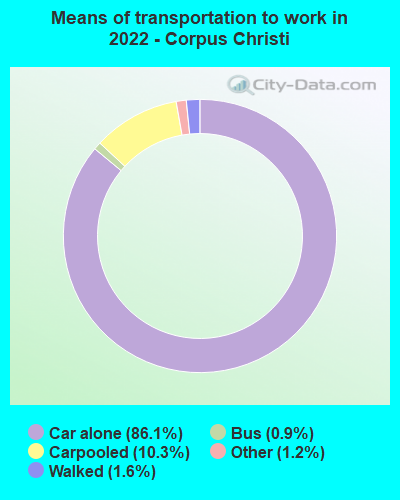
Means of transportation to work
Type
Indianapolis
Corpus Christi
Bicycle
0.5%
0.2%
Bus
1.2%
1.1%
Carpooled
8.5%
9.9%
Car alone
87.3%
86.5%
Motorcycle
0%
0.2%
Taxicab
0.1%
0.1%
Walked
1.6%
1.4%
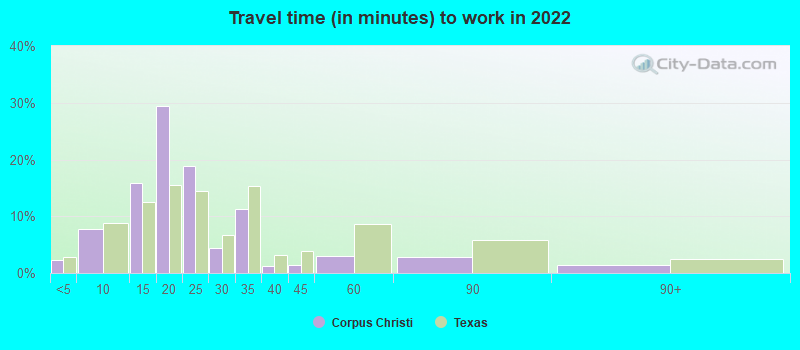
Average travel time to work
Type
Indianapolis
Corpus Christi
Average
28.1 min
21.4 min
Other means
22.5 min
20.1 min
Public transportation
40.2 min
37.6 min
Private vehicle occupancy
Type
Indianapolis
Corpus Christi
Average
1.2
1.1
Drove alone
88.2%
90.4%
In 2 person carpool
9.4%
7.6%
In 3 person carpool
1.3%
1.2%
In 4 person carpool
0.5%
0.4%
In 5-6 person carpool
0.4%
0.3%
In 7+ person carpool
0.1%
0%
How many people usually rode to work in the car, truck or van.
Real Estate
Regarding real estate, Indianapolis offers lower home prices compared to Corpus Christi. Rent prices are also generally cheaper in Indianapolis.
Neighborhoods
Both cities offer a diverse range of neighborhoods suitable for various lifestyles. Downtown Indianapolis is bustling and culturally captivating, while Broad Ripple Village is famous for its arts scene. In Corpus Christi, North Beach offers beautiful waterfront views, while the South Side is known for its suburban atmosphere.
Houses and residents
Type
Indianapolis
Corpus Christi
Houses
399,820
137,431
Average household size (people)
2.4
2.7
Median year apartment built
1977
1984
Median year house/condo built
1971
1981
Length of stay in the house since moving in
13 years
13.3 years
Houses occupied
358,150 (89.6%)
117,366 (85.4%)
Houses occupied by owners
201,149 (56.2%)
67,874 (57.8%)
Houses occupied by renters
157,001 (43.8%)
49,492 (42.2%)
Median rent asked for vacant for-rent units
$876.58
$1,470
Median monthly housing costs
$980
$1,102
Median price asked for vacant for-sale houses and condos
$283,027
$329,579
Estimated median house or condo value
$188,700
$171,500
Median numbers of rooms
5.5
4.9
Median number of rooms in apartments
4.3
4.1
Median number of rooms in houses and condos
6.5
5.6
Median house price - detached houses
$231,490
$212,792
Median house price - in 2-unit structures
$257,253
$219,111
Median house price - in 3-to-4-unit structures
$240,688
$270,664
Median house price - in 5 or more unit structures
$247,275
$270,817
Median house price - mobile homes
$58,413
$33,205
Median house price - Townhouses or other attached units
$222,424
$168,101
Median house price - All housing units
$229,666
$210,115
Median house age
48
40
Renting percentage
44.2%
40.7%
Housing density (houses/condos per square mile)
1,106.1
888.7
House value disparities
36.1%
37.5%
Household income disparities
44.4%
45%
Median household income for houses/condes with a mortgage
$86,008
$84,755
Median household income for apartments without a mortgage
$61,922
$55,283
Housing units without a mortgage
4,552 (3.2%)
190 (0.5%)
Housing units with both a second mortgage and home equity loan
9,787 (6.8%)
1,163 (3.1%)
Housing units with a mortgage
138,622 (96.8%)
37,907 (99.5%)
Housing units with a home equity loan
271 (0.2%)
0 (0%)
Housing units with a second mortgage
12,987 (9.1%)
1,292 (3.4%)
House/condo owner moved in on average (years ago)
11
11
House/condo renter moved in on average (years ago)
1
1
Housing units lacking complete kitchen facilities
3.4%
2.9%
Housing units lacking complete plumbing facilities
1.1%
2.8%
Housing units in structures
Housing units in structures
Indianapolis
Corpus Christi
One, detached
59.0%
65.0%
One, attached
9.2%
1.6%
Two
2.5%
3.0%
3 or 4
6.2%
6.5%
5 to 9
7.7%
8.7%
10 to 19
6.3%
5.7%
20 to 49
3.1%
2.3%
50 or more
5.0%
4.1%
Mobile homes
1.0%
2.8%
Boats, RVs, vans, etc.
0.0%
0.3%
Median real estate property taxes paid for housing units
Self-employed workers in own not incorporated business
17,131
10,817
State government workers
15,502
6,884
Unpaid family workers
1,601
230
Industries and Occupations
In Indianapolis, healthcare, manufacturing, and retail are the leading industries, with Indianapolis-based Eli Lilly being a major employer. Corpus Christi's economy revolves around petroleum refining, the military, and tourism.
Both cities have quality healthcare options. Indianapolis is home to the highly ranked Indiana University Health Medical Center, while Corpus Christi has the respected CHRISTUS Spohn Hospital Corpus Christi.
Health (county statistics)
Type
Indianapolis
Corpus Christi
General health status score of residents in this county from 1 (poor) to 5 (excellent)
Indianapolis' infrastructure is extensive and continuously developing, with an international airport, comprehensive road networks, and an efficient bus service. In Corpus Christi, the infrastructure is more tailored towards its tourism industry, featuring the Corpus Christi International Airport and the Port of Corpus Christi.
Infrastructure
Type
Indianapolis
Corpus Christi
Hospitals
76
34
TV stations
19
21
Arenas or stadiums
3
1
Bank branches located here
259
83
Bank institutions located here
27
17
Main business address for public companies
28
1
Drinking water stations with no reported violations in the past
1
1
Drinking water stations with reported violations in the past
HMDA - Conventional home purchase loans - Applications denied
Year
Indianapolis
Corpus Christi
1999
3,358
1,534
2000
3,562
814
2001
2,649
738
2002
1,915
631
2003
2,519
737
2004
3,702
1,013
2005
6,057
1,275
2006
5,811
1,217
2007
3,456
942
2008
1,247
546
2009
565
413
Culture and Food
Both cities offer rich cultural experiences. Indianapolis is known for its world-class museums, galleries, and performing arts venues. Corpus Christi has a vibrant culture influenced heavily by its coastal location and Hispanic heritage. Seafood is prevalent in Corpus Christi's local cuisine, while Indianapolis has a diverse food scene, including its famous pork tenderloin sandwich.
Sports Teams
Indianapolis is home to two major professional sports teams, the Indianapolis Colts (NFL) and the Indiana Pacers (NBA). Corpus Christi has the Corpus Christi Hooks, a minor league baseball team, and the IceRays, a junior ice hockey team.


 Indianapolis, IN and
  Corpus Christi, TX : 1,052.0 miles