When comparing Las Vegas, NV, and Albuquerque, NM, we can see significant contrasts across various domains. Between these two cultural entertainment hubs known for their vibrant character and unique charm, each city offers a different perspective on lifestyle factors, from weather and cost of living to education and healthcare. Despite their distinct personalities, both cities are attractive for relocation and short-term tours depending on individual preferences, needs, and lifestyle choices.
Distance between
Las Vegas, NV and
Albuquerque, NM : 489.1 miles
Las Vegas's population is larger by 15%. Its population has grown by 168,356 people (35.2%) since 2000. The population of Albuquerque has grown by 113,992 people (25.4%) during that time.
Looking at crime rates, both cities have been battling high crime rates over the years. Las Vegas Metro Police are constantly working to decrease crime, particularly on the Strip where a majority of tourists gather. Albuquerque also struggles with crime; however, officials note that crime rates have been gradually decreasing in recent years. Both cities have neighborhood watch programs and community initiatives designed to combat crime and promote safety.
City-data.com crime index counts serious crimes and violent crime more heavily. It adjusts for the number of visitors and daily workers commuting into cities. (higher means more crime, U.S. average = 301.1)
City-data.com crime index counts serious crimes and violent crime more heavily. It adjusts for the number of visitors and daily workers commuting into cities. (higher means more crime, U.S. average = 301.1)
Sex Offenders
According to our data, there are 4,803 registered sex offenders living in Las Vegas and 886 registered sex offenders living in . The ratio of residents to sex offenders in Las Vegas is 132 to 1; the ratio in Albuquerque is 631 to 1. The number of registered sex offenders compared to the number of residents is much larger in Las Vegas than that in Albuquerque.
Cost of Living
The cost of living is another critical factor. Las Vegas enjoys a relatively reasonable cost of living, with housing being cheaper compared to the national average. Albuquerque is even more affordable, offering lower prices for housing, groceries, and healthcare compared to Las Vegas and national averages. Both cities are considered suitable for those seeking affordability.
Income Tax
Las Vegas residents enjoy Nevada's status as a state with no income tax. Conversely, Albuquerque residents, like all New Mexico residents, must pay state income tax.
Property Tax
Las Vegas property taxes are somewhat middle-of-the-road compared to other US cities, whereas Albuquerque typically sees lower property tax rates than Las Vegas and many other cities.
Sales Tax
Nevada, and subsequently Las Vegas, has one of the highest combined state and local sales tax rates, while New Mexico’s sales taxes are more moderate.
Income
Type
Las Vegas
Albuquerque
Estimated median household income
$59,746
$58,512
Estimated per capita income
$33,825
$35,738
Cost of living index (U.S. average is 100)
99.1
93.6
If you make $50,000 in Albuquerque, you will have to make $52,938 in Las Vegas to maintain the same standard of living.
Geographical Conditions
Las Vegas is located in a basin on the floor of the Mojave Desert and is surrounded by mountain ranges on all sides, whereas Albuquerque is nestled in the high desert and flanked by the Sandia Mountains.
Education opportunities vary between the two cities. Las Vegas offers a multitude of public and private schools, along with higher education institutions like the College of Southern Nevada and the University of Nevada, Las Vegas. Albuquerque also offers a robust public and private school system, in addition to the Central New Mexico Community College and the University of New Mexico.
Economically, Las Vegas thrives on the tourism, entertainment, and hospitality industries. Meanwhile, Albuquerque’s economy is a mix of government agencies (like the airforce base), healthcare, and education, with a growing tech scene.
Biggest Employers
In Las Vegas, the largest employers are typically tied to the hospitality or gaming industry, like MGM Resorts International or Caesars Entertainment. On the other hand, Albuquerque’s biggest employers include the University of New Mexico, Kirtland Air Force Base, and Sandia National Laboratories.
There were 2,700 building permits issued in Las Vegas in 2012 (1886 more than in 2011) compared to 773 building permits issued in Albuquerque in 2012 (19 more than in 2011).
In Las Vegas (Clark County), 56.4% voted for Democrats and 41.8% for Republicans in 2012 Presidential Election. In Albuquerque (Bernalillo County), 55.8% voted for Democrats and 39.4% for Republicans.
Elections
Type
Democrats
Republicans
Other
Year
Las Vegas
Albuquerque
Las Vegas
Albuquerque
Las Vegas
Albuquerque
2020
53.7%
61.3%
44.3%
36.7%
2.0%
2.0%
2016
52.4%
52.4%
41.7%
34.6%
5.8%
13.0%
2012
56.4%
55.8%
41.8%
39.4%
1.8%
4.9%
2008
58.5%
60.2%
39.5%
38.8%
2.0%
1.0%
2004
51.8%
51.6%
46.9%
47.4%
1.3%
0.9%
2000
51.4%
48.8%
44.8%
46.8%
3.8%
4.4%
1996
75.5%
48.3%
18.8%
43.2%
5.7%
8.5%
Breakdown of population affiliated with a religious congregation
Type
Adherents
Congregations
Religion
Las Vegas
Albuquerque
Las Vegas
Albuquerque
CATHOLIC CHURCH
18.1%
26.5%
4.0%
10.7%
SOUTHERN BAPTIST CONVENTION
1.6%
2.6%
11.2%
11.4%
EVANGELICAL LUTHERAN CHURCH IN AMERICA
0.4%
0.4%
1.6%
1.9%
LUTHERAN CHURCH
0.2%
0.3%
1.2%
1.7%
SEVENTH DAY ADVENTIST CHURCH
0.2%
0.4%
1.6%
1.9%
EPISCOPAL CHURCH
0.1%
0.7%
1.1%
1.9%
Weather
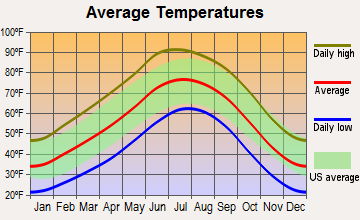
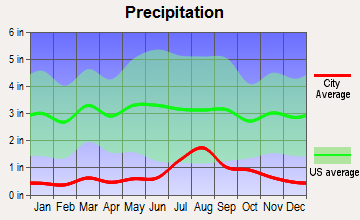
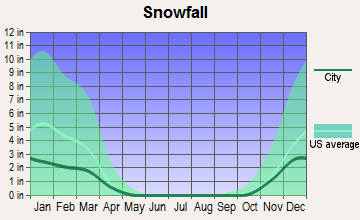
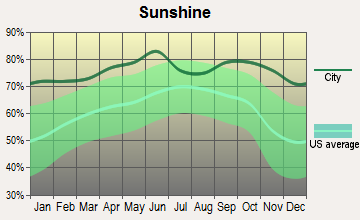
Climate varies between the two cities. Las Vegas is known for its hot desert climate, with fierce summers that can exceed 100°F, while winters are generally mild. Albuquerque, in contrast, experiences a semi-arid climate, with more moderate summer temperatures and colder winters with occasional snowfall. Both cities enjoy a high number of sunshine days annually, making them popular destinations for individuals seeking plenty of sunshine.
Weather and climate
Type
Las Vegas
Albuquerque
Temperature - Average
65.5°F
55.6°F
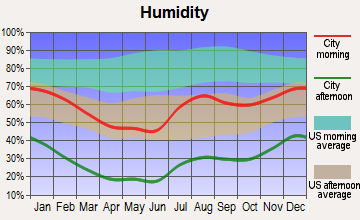
Humidity - Average morning or afternoon humidity
30.7%
44.3%
Humidity - Differences between morning and afternoon humidity
42%
46%
Humidity - Maximum monthly morning or afternoon humidity
52%
63%
Humidity - Minimum monthly morning or afternoon humidity
10%
17%
Precipitation - Yearly average
5.7 in
9.4 in
Snowfall - Yearly average
1.6 in
19.2 in
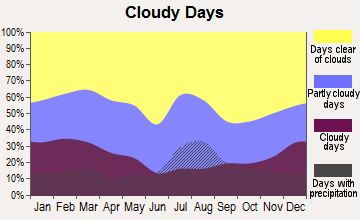
Clouds - Number of days clear of clouds
35.1%
27.8%
Sunshine amount - Average
91.8%
82.7%
Sunshine amount - Differences during a year
16%
9%
Sunshine amount - Maximum monthly
92%
82%
Sunshine amount - Minimum monthly
76%
73%
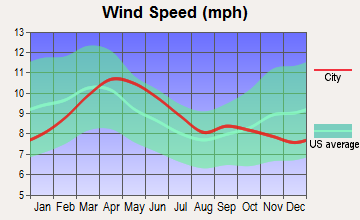
Wind speed - Average
9.2 mph
8.9 mph
Average climate in Las Vegas, Nevada
Average climate in Albuquerque, New Mexico
Air pollution
Type
AQI
CO
NO2
OZONE
PB
PM10
PM25
SO2
Year
Las Vegas
Albuquerque
Las Vegas
Albuquerque
Las Vegas
Albuquerque
Las Vegas
Albuquerque
Albuquerque
Las Vegas
Albuquerque
Las Vegas
Albuquerque
Las Vegas
Albuquerque
2018
100
95
0.42
0.23
13.1
10.3
37.2
35.3
N/A
N/A
24.4
20.3
6.0
4.3
0.7
0.5
2017
101
82
0.29
0.24
13.0
10.4
38.5
33.5
N/A
N/A
20.3
18.4
7.3
5.7
0.8
0.4
2016
97
86
0.38
0.22
11.2
10.4
36.5
33.2
N/A
N/A
20.6
16.0
8.7
5.3
0.8
0.8
2015
92
84
0.36
0.23
12.4
11.2
35.6
30.8
N/A
N/A
18.9
16.0
8.4
6.1
1.2
0.7
2014
91
89
0.40
0.22
10.8
11.7
36.5
31.8
N/A
N/A
21.1
22.0
9.2
6.1
1.4
0.6
2013
103
91
0.45
0.22
9.6
11.8
36.9
34.1
N/A
N/A
22.1
21.8
8.6
5.7
1.5
0.8
2012
94
116
0.49
0.18
5.9
13.7
38.5
33.6
N/A
N/A
21.5
26.6
8.3
9.3
1.4
0.7
2011
85
130
0.40
0.21
5.3
13.5
37.5
34.0
N/A
N/A
18.2
28.6
7.8
9.9
1.2
0.4
2010
86
92
0.50
0.15
5.7
12.2
36.6
32.1
N/A
N/A
16.1
25.1
7.1
6.8
N/A
N/A
2009
87
81
0.56
0.16
6.0
12.5
33.3
30.4
N/A
N/A
20.9
26.2
8.3
6.9
N/A
N/A
2008
82
91
0.66
0.21
8.2
11.8
33.0
31.5
N/A
N/A
N/A
20.8
9.2
6.5
N/A
N/A
2007
97
112
0.61
0.29
11.7
13.0
32.4
31.4
N/A
N/A
N/A
19.7
8.6
6.7
0.1
N/A
2006
102
103
0.75
0.33
13.4
14.2
32.7
31.8
N/A
N/A
N/A
21.1
8.3
N/A
0.8
N/A
2005
100
85
0.76
0.32
15.1
13.9
30.2
29.7
N/A
N/A
N/A
20.0
7.8
N/A
5.3
N/A
2004
85
89
0.71
0.32
16.0
16.6
30.6
29.8
0.003
N/A
N/A
21.5
N/A
N/A
1.6
N/A
2003
99
115
0.67
0.37
15.9
17.6
29.8
31.9
0.004
N/A
N/A
25.1
N/A
N/A
1.0
N/A
2002
94
91
0.73
0.43
15.7
18.9
30.6
29.1
0.005
N/A
N/A
23.1
N/A
N/A
0.7
N/A
2001
95
81
0.76
0.67
15.0
17.2
29.4
29.4
N/A
N/A
N/A
20.9
N/A
N/A
1.1
N/A
2000
95
95
0.88
0.81
14.7
17.0
29.7
27.9
N/A
N/A
N/A
17.7
N/A
N/A
0.4
N/A
Natural disasters
Type
Las Vegas
Albuquerque
Tornado activity compared to U.S. average
2.1%
6.4%
Earthquake activity compared to U.S. average
6,093.4%
802.6%
Natural disasters compared to U.S. average
12%
9%
Transportation
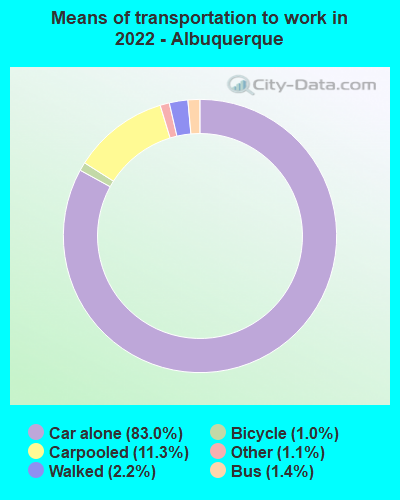
Getting around in Las Vegas is quite straightforward, with comprehensive bus services and an efficient monorail system primarily serving the Strip area. Albuquerque offers a decent public transportation system, comprising buses and a commuter rail line connecting it to Santa Fe.
Transport
Type
Las Vegas
Albuquerque
Amtrak stations
1
1
Amtrak stations nearby
1
1
FAA registered aircraft
1
1
FAA registered aircraft manufacturers and dealers
81
17
Means of transportation to work
Type
Las Vegas
Albuquerque
Bicycle
0.1%
0.9%
Bus
2.2%
0.8%
Carpooled
10.3%
9.6%
Car alone
82.7%
85.1%
Motorcycle
0.4%
0.2%
Walked
1.4%
2.3%
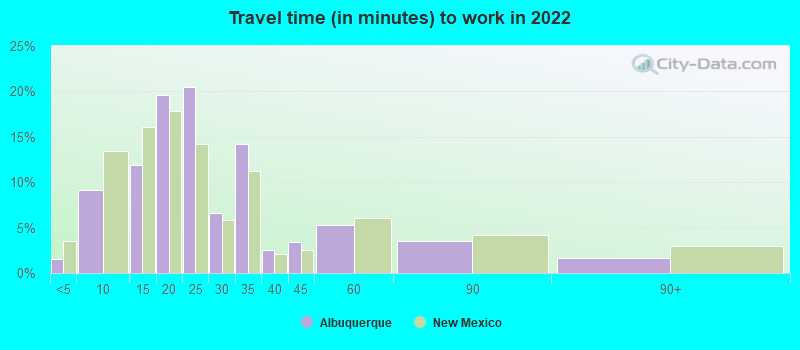
Average travel time to work
Type
Las Vegas
Albuquerque
Average
26.3 min
24.5 min
Other means
24 min
20.8 min
Public transportation
49.9 min
37.8 min
Private vehicle occupancy
Type
Las Vegas
Albuquerque
Average
1.2
1.1
Drove alone
88.9%
91.6%
In 2 person carpool
8.2%
6.6%
In 3 person carpool
2.1%
1.2%
In 4 person carpool
0.2%
0.3%
In 5-6 person carpool
0.4%
0.1%
In 7+ person carpool
0.2%
0.2%
How many people usually rode to work in the car, truck or van.
Real Estate
Real estate markets vary between the two cities. Las Vegas' real estate market has been known to experience significant fluctuation, especially due to the impact of tourism on property demand. Albuquerque's real estate market is more stable, with property values consistently increasing over time.
Neighborhoods
Las Vegas and Albuquerque both offer varied neighborhoods, catering to different lifestyles. Las Vegas offers everything from the bustling downtown area to quiet suburban neighborhoods. Albuquerque, while smaller, provides a variety of choices from historic districts to modern, upscale neighborhoods.
Houses and residents
Type
Las Vegas
Albuquerque
Houses
269,602
256,814
Average household size (people)
2.7
2.4
Median year apartment built
1991
1983
Median year house/condo built
1995
1984
Length of stay in the house since moving in
10.1 years
12.6 years
Houses occupied
250,350 (92.9%)
243,582 (94.8%)
Houses occupied by owners
138,677 (55.4%)
147,964 (60.7%)
Houses occupied by renters
111,673 (44.6%)
95,618 (39.3%)
Median rent asked for vacant for-rent units
$1,176
$893.82
Median monthly housing costs
$1,255
$1,021
Median price asked for vacant for-sale houses and condos
$989,410
$171,149
Estimated median house or condo value
$362,400
$251,500
Median numbers of rooms
5.2
5.3
Median number of rooms in apartments
4.1
3.9
Median number of rooms in houses and condos
6.1
6.2
Median house price - detached houses
$439,169
$290,578
Median house price - in 2-unit structures
$161,204
$636,758
Median house price - in 3-to-4-unit structures
$201,871
$274,794
Median house price - in 5 or more unit structures
$327,174
$224,872
Median house price - mobile homes
$113,235
$52,392
Median house price - Townhouses or other attached units
$274,961
$209,825
Median house price - All housing units
$417,434
$271,083
Median house age
27
38
Renting percentage
43.5%
39.7%
Housing density (houses/condos per square mile)
2,379.4
1,421.7
House value disparities
27.1%
29.8%
Household income disparities
47.1%
45.9%
Median household income for houses/condes with a mortgage
$90,388
$87,851
Median household income for apartments without a mortgage
$62,287
$63,195
Housing units without a mortgage
1,172 (1.2%)
1,631 (1.6%)
Housing units with both a second mortgage and home equity loan
4,450 (4.6%)
3,560 (3.6%)
Housing units with a mortgage
95,992 (98.8%)
97,744 (98.4%)
Housing units with a home equity loan
178 (0.2%)
309 (0.3%)
Housing units with a second mortgage
5,092 (5.2%)
6,864 (6.9%)
House/condo owner moved in on average (years ago)
7
11
House/condo renter moved in on average (years ago)
2
1
Housing units lacking complete kitchen facilities
1.3%
1.1%
Housing units lacking complete plumbing facilities
1%
0.3%
Housing units in structures
Housing units in structures
Las Vegas
Albuquerque
One, detached
61.5%
61.4%
One, attached
5.3%
6.6%
Two
1.3%
1.0%
3 or 4
7.7%
6.1%
5 to 9
8.4%
4.7%
10 to 19
4.8%
4.7%
20 to 49
2.8%
4.8%
50 or more
6.8%
6.3%
Mobile homes
1.4%
4.2%
Boats, RVs, vans, etc.
0.1%
0.0%
Median real estate property taxes paid for housing units
Self-employed workers in own not incorporated business
18,990
14,060
State government workers
6,950
20,531
Unpaid family workers
614
359
Industries and Occupations
The most prominent industries in Las Vegas are hospitality and tourism, providing a multitude of occupations ranging from casino workers to hotel management. In contrast, Albuquerque has a diverse economy, with sectors including education, healthcare, retail trade, and professional services leading in employment opportunities.
Both cities host several highly-rated hospitals and health care facilities. Las Vegas's healthcare offerings are boosted by the city's focus on tourism, while Albuquerque's healthcare networks are comprehensive, led by institutions like the University of New Mexico Hospital.
Health (county statistics)
Type
Las Vegas
Albuquerque
General health status score of residents in this county from 1 (poor) to 5 (excellent)
In terms of infrastructure, Las Vegas offers high-quality infrastructure to support its bustling tourism sector, from world-class airports to well-maintained roads. Albuquerque might not match Las Vegas's scale but comes forward with decent infrastructure, including the Sunport airport and a well-maintained network of highways.
Infrastructure
Type
Las Vegas
Albuquerque
Hospitals
39
36
TV stations
12
18
Arenas or stadiums
2
1
Bank branches located here
281
137
Bank institutions located here
34
24
Main business address for public companies
57
8
Drinking water stations with no reported violations in the past
32
7
Drinking water stations with reported violations in the past
HMDA - Conventional home purchase loans - Applications denied
Year
Las Vegas
Albuquerque
1999
2,657
2,651
2000
579
1,303
2001
371
752
2002
380
693
2003
3,590
1,022
2004
5,908
1,729
2005
7,894
2,199
2006
6,914
2,639
2007
3,733
1,575
2008
1,431
654
2009
813
368
Culture and Food
Both cities offer a rich cultural scene. Las Vegas is famous for its glitzy nightlife, high-end restaurants, and world-renowned shows, while Albuquerque is known for its rich Native American and Spanish heritage reflected in numerous cultural events and authentic cuisine.
Sports Teams
Las Vegas is home to professional teams like the Las Vegas Raiders (NFL) and the Vegas Golden Knights (NHL). Albuquerque doesn’t have any major league teams, but it does host the Albuquerque Isotopes, a minor league baseball team.


 Las Vegas, NV
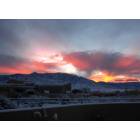
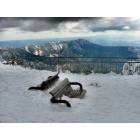
 Albuquerque, NM