This comparison breakdown focuses on Las Vegas, Nevada (NV), and Oxnard, California (CA). They are both exciting cities with unique characteristics like Las Vegas, known for its vibrant nightlife, entertainment scene, and Oxnard, popular for its spectacular coastal beauty and agricultural prowess. Both are highly considered for travel or relocation due to their unique attractions, weather conditions, and opportunities. This guide aims to answer key considerations like crime and safety, cost of living, work opportunities, real estate, transportation, taxes, cultural experience, sports teams, and health care.
Distance between
Las Vegas, NV and
Oxnard, CA : 262.9 miles
Las Vegas's population is larger by 220%. Its population has grown by 168,356 people (35.2%) since 2000. The population of Oxnard has grown by 31,521 people (18.5%) during that time.
Las Vegas has a crime rate higher than the national average, due in part to its bustling nightlife and significant tourist population. However, many safe neighborhoods like Summerlin and Henderson offer secure living conditions. On the other side, Oxnard's crime rate is slightly above the national average, but it's worth noting there are safe neighborhoods like River Ridge and Oxnard Shores as well.
City-data.com crime index counts serious crimes and violent crime more heavily. It adjusts for the number of visitors and daily workers commuting into cities. (higher means more crime, U.S. average = 301.1)
City-data.com crime index counts serious crimes and violent crime more heavily. It adjusts for the number of visitors and daily workers commuting into cities. (higher means more crime, U.S. average = 301.1)
Sex Offenders
According to our data, there are 4,789 registered sex offenders living in Las Vegas and 241 registered sex offenders living in . The ratio of residents to sex offenders in Las Vegas is 132 to 1; the ratio in Oxnard is 863 to 1. The number of registered sex offenders compared to the number of residents is much larger in Las Vegas than that in Oxnard.
Cost of Living
Overall, the cost of living is higher in Oxnard compared to Las Vegas. Las Vegas often appeals to people as Nevada has no state income tax and typically has lower housing costs. Oxnard, while more expensive, offers proximity to the ocean and access to fresh produce due to its agricultural industries.
Income Tax
Nevada, where Las Vegas is located, has no state income tax. This can be beneficial for higher earners. On the contrary, California has a progressive state income tax, ranking as one of the highest in the nation.
Property Tax
Las Vegas's property tax rate is generally lower than Oxnard's. This difference may make Las Vegas more attractive to potential homebuyers.
Sales Tax
Nevada has a higher sales tax rate than California, but Las Vegas has no additional local sales tax. In contrast, Oxnard is subject to California's sales tax, plus a local district tax.
Income
Type
Las Vegas
Oxnard
Estimated median household income
$59,746
$88,268
Estimated per capita income
$33,825
$27,431
Cost of living index (U.S. average is 100)
99.1
92.9
If you make $50,000 in Oxnard, you will have to make $53,337 in Las Vegas to maintain the same standard of living.
Geographical Conditions
Las Vegas is situated in a desert valley surrounded by mountains, while Oxnard is a coastal city nestled between Los Angeles and Santa Barbara. These geographical conditions significantly shape each city's climate and outdoors opportunities.
Las Vegas's Clark County School District is one of the largest in the U.S. The city also hosts the University of Nevada, Las Vegas. Oxnard is home to the Oxnard School District and Oxnard College, a community college that provides associates degrees and vocational certificates.
Las Vegas's economy is deeply rooted in tourism, entertainment, and hospitality. On the contrary, Oxnard's economic backbone is primarily agriculture, manufacturing, and defense, giving it a more diversified economic landscape.
Biggest Employers
In Las Vegas, MGM Resorts International and Caesars Entertainment are among the biggest employers. For Oxnard, the largest employers are St. John's Regional Medical Center and the U.S. Navy via the Naval Base Ventura County.
There were 2,700 building permits issued in Las Vegas in 2012 (1886 more than in 2011) compared to 52 building permits issued in Oxnard in 2012 (4 less than in 2011).
In Las Vegas (Clark County), 56.4% voted for Democrats and 41.8% for Republicans in 2012 Presidential Election. In Oxnard (Ventura County), 52.2% voted for Democrats and 45.2% for Republicans.
Elections
Type
Democrats
Republicans
Other
Year
Las Vegas
Oxnard
Las Vegas
Oxnard
Las Vegas
Oxnard
2020
53.7%
59.6%
44.3%
38.5%
2.0%
1.9%
2016
52.4%
54.6%
41.7%
37.2%
5.8%
8.2%
2012
56.4%
52.2%
41.8%
45.2%
1.8%
2.7%
2008
58.5%
55.2%
39.5%
42.9%
2.0%
1.9%
2004
51.8%
47.8%
46.9%
51.5%
1.3%
0.8%
2000
51.4%
47.2%
44.8%
48.3%
3.8%
4.5%
1996
75.5%
44.1%
18.8%
43.5%
5.7%
12.4%
Breakdown of population affiliated with a religious congregation
Type
Adherents
Congregations
Religion
Las Vegas
Oxnard
Las Vegas
Oxnard
CATHOLIC CHURCH
18.1%
28.2%
4.0%
4.1%
SOUTHERN BAPTIST CONVENTION
1.6%
0.6%
11.2%
5.0%
EVANGELICAL LUTHERAN CHURCH IN AMERICA
0.4%
0.9%
1.6%
2.3%
LUTHERAN CHURCH
0.2%
0.5%
1.2%
2.5%
SEVENTH DAY ADVENTIST CHURCH
0.2%
0.4%
1.6%
2.1%
MUSLIM ESTIMATE
0.1%
0.4%
0.6%
0.6%
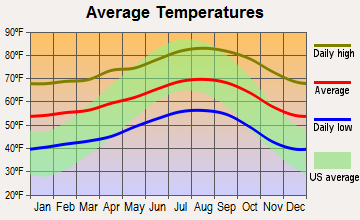
Weather
Las Vegas falls within a desert climate, experiencing hot summers and mild winters. On the other hand, Oxnard has a Mediterranean climate with comfortable summers and mild winters. Oxnard's proximity to the ocean result in more regulated temperatures compared to Las Vegas' desert extremes.
Weather and climate
Type
Las Vegas
Oxnard
Temperature - Average
65.5°F
61.5°F
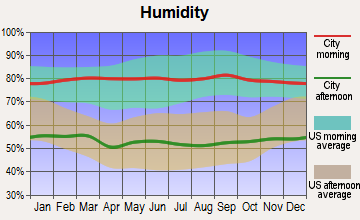
Humidity - Average morning or afternoon humidity
30.7%
70.9%
Humidity - Differences between morning and afternoon humidity
42%
23.2%
Humidity - Maximum monthly morning or afternoon humidity
52%
78.4%
Humidity - Minimum monthly morning or afternoon humidity
10%
55.2%
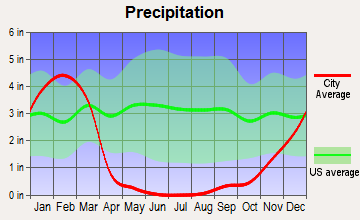
Precipitation - Yearly average
5.7 in
17.5 in
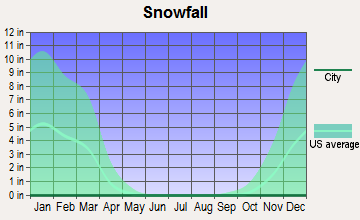
Snowfall - Yearly average
1.6 in
0 in
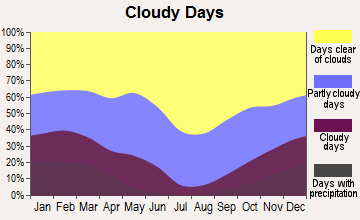
Clouds - Number of days clear of clouds
35.1%
27.2%
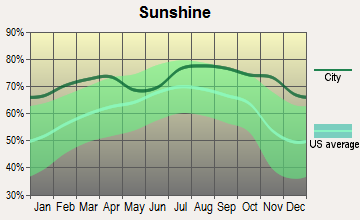
Sunshine amount - Average
91.8%
78.4%
Sunshine amount - Differences during a year
16%
21.9%
Sunshine amount - Maximum monthly
92%
84.9%
Sunshine amount - Minimum monthly
76%
63%
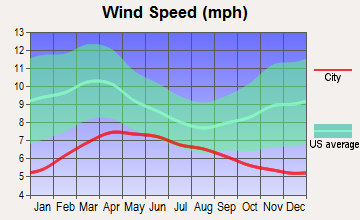
Wind speed - Average
9.2 mph
4.9 mph
Average climate in Las Vegas, Nevada
Average climate in Oxnard, California
Air pollution
Type
AQI
CO
NO2
OZONE
PM10
PM25
SO2
Year
Las Vegas
Oxnard
Las Vegas
Oxnard
Las Vegas
Oxnard
Las Vegas
Oxnard
Las Vegas
Oxnard
Las Vegas
Oxnard
Las Vegas
2018
100
87
0.42
N/A
13.1
5.3
37.2
27.8
24.4
27.1
6.0
8.6
0.7
N/A
2017
101
125
0.29
N/A
13.0
5.2
38.5
29.4
20.3
29.3
7.3
9.7
0.8
N/A
2016
97
78
0.38
N/A
11.2
5.2
36.5
27.7
20.6
24.5
8.7
8.4
0.8
N/A
2015
92
82
0.36
N/A
12.4
5.9
35.6
27.5
18.9
25.6
8.4
9.4
1.2
N/A
2014
91
86
0.40
N/A
10.8
6.0
36.5
27.1
21.1
27.3
9.2
9.3
1.4
N/A
2013
103
90
0.45
N/A
9.6
6.4
36.9
27.4
22.1
27.0
8.6
9.5
1.5
N/A
2012
94
95
0.49
N/A
5.9
7.0
38.5
27.1
21.5
N/A
8.3
8.7
1.4
N/A
2011
85
79
0.40
N/A
5.3
7.0
37.5
28.7
18.2
N/A
7.8
N/A
1.2
N/A
2010
86
74
0.50
N/A
5.7
6.9
36.6
28.4
16.1
N/A
7.1
N/A
N/A
N/A
2009
87
84
0.56
N/A
6.0
7.8
33.3
27.6
20.9
N/A
8.3
N/A
N/A
N/A
2008
82
86
0.66
N/A
8.2
8.1
33.0
28.0
N/A
N/A
9.2
N/A
N/A
N/A
2007
97
90
0.61
N/A
11.7
9.6
32.4
26.7
N/A
N/A
8.6
N/A
0.1
N/A
2006
102
88
0.75
N/A
13.4
9.6
32.7
26.2
N/A
N/A
8.3
N/A
0.8
N/A
2005
100
92
0.76
N/A
15.1
10.4
30.2
26.1
N/A
N/A
7.8
N/A
5.3
N/A
2004
85
100
0.71
N/A
16.0
10.3
30.6
26.5
N/A
N/A
N/A
N/A
1.6
N/A
2003
99
108
0.67
0.43
15.9
10.5
29.8
26.6
N/A
N/A
N/A
N/A
1.0
N/A
2002
94
109
0.73
0.26
15.7
9.6
30.6
27.2
N/A
N/A
N/A
N/A
0.7
N/A
2001
95
114
0.76
0.23
15.0
10.9
29.4
26.6
N/A
N/A
N/A
N/A
1.1
N/A
2000
95
105
0.88
0.27
14.7
12.5
29.7
23.9
N/A
N/A
N/A
N/A
0.4
N/A
Natural disasters
Type
Las Vegas
Oxnard
Tornado activity compared to U.S. average
2.1%
7.2%
Earthquake activity compared to U.S. average
6,093.4%
6,722.6%
Natural disasters compared to U.S. average
12%
36%
Transportation
Las Vegas has an extensive public transportation network, including buses, monorails, and ride-hailing services. Oxnard, although having a comprehensive bus system, also has connections to major Californian cities via Amtrak and Metrolink services.
Transport
Type
Las Vegas
Oxnard
Amtrak stations
1
1
Amtrak stations nearby
1
3
FAA registered aircraft
1
100
FAA registered aircraft manufacturers and dealers
81
7
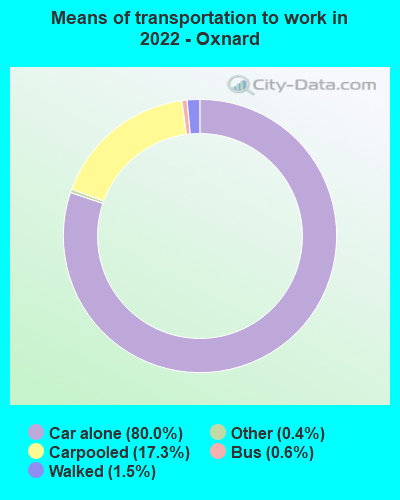
Means of transportation to work
Type
Las Vegas
Oxnard
Bicycle
0.1%
0.3%
Bus
2.2%
0.6%
Carpooled
10.3%
12.9%
Car alone
82.7%
83.8%
Motorcycle
0.4%
0.1%
Walked
1.4%
1.7%
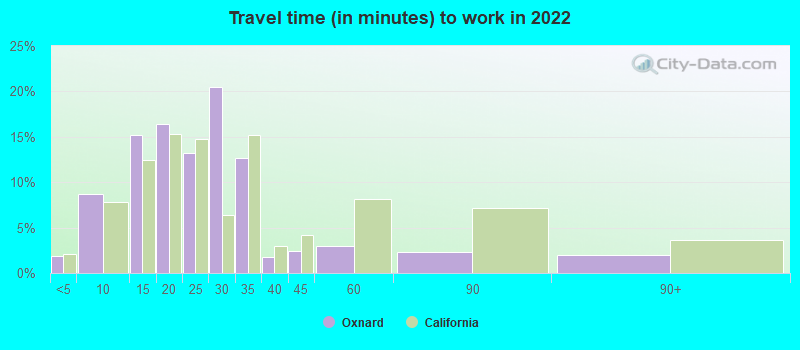
Average travel time to work
Type
Las Vegas
Oxnard
Average
26.3 min
24.3 min
Other means
24 min
23.3 min
Public transportation
49.9 min
44.5 min
Private vehicle occupancy
Type
Las Vegas
Oxnard
Average
1.2
1.3
Drove alone
88.9%
79.7%
In 2 person carpool
8.2%
16.6%
In 3 person carpool
2.1%
2%
In 4 person carpool
0.2%
1.4%
In 5-6 person carpool
0.4%
0.3%
In 7+ person carpool
0.2%
0%
How many people usually rode to work in the car, truck or van.
Real Estate
Housing prices in Las Vegas are generally lower than in Oxnard. As a result, Las Vegas may be more attractive for homebuyers on a budget. Oxnard's real estate tends to be pricier but offers coastal properties and picturesque locations.
Neighborhoods
Las Vegas has a diverse array of neighborhoods ranging from upscale areas like Summerlin to more artistic communities such as the Downtown Arts District. Oxnard boasts desirable neighborhoods like River Ridge and Oxnard Shores, known for their coastal beauty and community feel.
Houses and residents
Type
Las Vegas
Oxnard
Houses
269,602
53,778
Average household size (people)
2.7
4
Median year apartment built
1991
1976
Median year house/condo built
1995
1978
Length of stay in the house since moving in
10.1 years
16.7 years
Houses occupied
250,350 (92.9%)
50,611 (94.1%)
Houses occupied by owners
138,677 (55.4%)
28,798 (56.9%)
Houses occupied by renters
111,673 (44.6%)
21,813 (43.1%)
Median rent asked for vacant for-rent units
$1,176
$2,319
Median monthly housing costs
$1,255
$1,776
Median price asked for vacant for-sale houses and condos
$989,410
$504,898
Estimated median house or condo value
$362,400
$569,700
Median numbers of rooms
5.2
5.1
Median number of rooms in apartments
4.1
4
Median number of rooms in houses and condos
6.1
6
Median house price - detached houses
$439,169
$630,609
Median house price - in 2-unit structures
$161,204
$186,823
Median house price - in 3-to-4-unit structures
$201,871
$312,007
Median house price - in 5 or more unit structures
$327,174
$381,886
Median house price - mobile homes
$113,235
$168,766
Median house price - Townhouses or other attached units
$274,961
$471,060
Median house price - All housing units
$417,434
$563,725
Median house age
27
44
Renting percentage
43.5%
44.3%
Housing density (houses/condos per square mile)
2,379.4
2,124.4
House value disparities
27.1%
23%
Household income disparities
47.1%
38.3%
Median household income for houses/condes with a mortgage
$90,388
$113,007
Median household income for apartments without a mortgage
$62,287
$93,319
Housing units without a mortgage
1,172 (1.2%)
341 (1.7%)
Housing units with both a second mortgage and home equity loan
4,450 (4.6%)
1,053 (5.3%)
Housing units with a mortgage
95,992 (98.8%)
19,481 (98.3%)
Housing units with a home equity loan
178 (0.2%)
0 (0%)
Housing units with a second mortgage
5,092 (5.2%)
1,193 (6%)
House/condo owner moved in on average (years ago)
7
14
House/condo renter moved in on average (years ago)
2
4
Housing units lacking complete kitchen facilities
1.3%
1.2%
Housing units lacking complete plumbing facilities
1%
0.6%
Housing units in structures
Housing units in structures
Las Vegas
Oxnard
One, detached
61.5%
53.4%
One, attached
5.3%
11.2%
Two
1.3%
1.0%
3 or 4
7.7%
5.8%
5 to 9
8.4%
5.8%
10 to 19
4.8%
8.0%
20 to 49
2.8%
4.2%
50 or more
6.8%
5.5%
Mobile homes
1.4%
5.1%
Boats, RVs, vans, etc.
0.1%
0.1%
Median real estate property taxes paid for housing units
Self-employed workers in own not incorporated business
18,990
3,104
State government workers
6,950
2,796
Unpaid family workers
614
0
Industries and Occupations
Las Vegas's main industries are gaming, hospitality, and entertainment. Oxnard's core industries are agriculture, manufacturing, and defense. These city-specific industries influence their primary occupational opportunities.
Both cities have robust healthcare systems. Las Vegas is home to world-class medical facilities like the UMC of Southern Nevada. Oxnard hosts the St. John's Regional Medical Center, a part of the Dignity Health network.
Las Vegas is known for its extensive infrastructure catering to tourism including hotels, casinos, restaurants, and attractions. Oxnard is characterized by a blend of residential, commercial, and industrial infrastructure, along with a significant agricultural sector.
Infrastructure
Type
Las Vegas
Oxnard
Hospitals
39
6
TV stations
12
4
Bank branches located here
281
25
Bank institutions located here
34
14
Main business address for public companies
57
1
Drinking water stations with no reported violations in the past
32
1
Drinking water stations with reported violations in the past
HMDA - Conventional home purchase loans - Applications denied
Year
Las Vegas
Oxnard
1999
2,657
308
2000
579
337
2001
371
322
2002
380
400
2003
3,590
739
2004
5,908
823
2005
7,894
1,172
2006
6,914
1,171
2007
3,733
900
2008
1,431
527
2009
813
210
Culture and Food
Las Vegas is renowned for its entertainment, cultural, and culinary scene. Oxnard, while it might not boast the same level of entertainment, is known for its multicultural population, leading to a diverse food scene, and the annual California Strawberry Festival.
Sports Teams
Las Vegas hosts a variety of professional sports teams, including the Las Vegas Raiders (NFL), the Vegas Golden Knights (NHL), and Las Vegas Aces (WNBA). Oxnard does not have its own professional sports teams but is proximate to Los Angeles' sports teams.


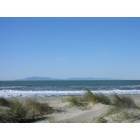
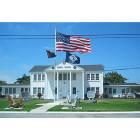
 Las Vegas, NV
 Oxnard, CA