Memphis, TN and Huntsville, AL are two diverse cities each with unique characteristics. While Memphis is known for its vibrant music and food culture, Huntsville boasts a prospering tech industry and lower cost of living. However, both cities offer varying lifestyles, considering factors such as weather, education, and industries, among others. Safety, tax structures, infrastructure, and sports scene also significantly differ in each city, catering differently according to individual preferences.
Distance between
Memphis, TN and
Huntsville, AL : 193.2 miles
Memphis's population is larger by 190%. Its population has decreased by 21,973 people (3.4%) since 2000. The population of Huntsville has grown by 58,747 people (37.1%) during that time.
Safety is a vital consideration for anyone moving or traveling to a new city. Memphis has higher crime rates than the national average, contributing to some safety concerns. However, neighborhood vigilance and police efforts are on to address this with several safe communities like East Memphis offering peace of mind. On the contrary, Huntsville is generally safer with crime rates lower than the national average. Areas like Twickenham and Jones Valley are particularly safe and desirable.
City-data.com crime index counts serious crimes and violent crime more heavily. It adjusts for the number of visitors and daily workers commuting into cities. (higher means more crime, U.S. average = 301.1)
City-data.com crime index counts serious crimes and violent crime more heavily. It adjusts for the number of visitors and daily workers commuting into cities. (higher means more crime, U.S. average = 301.1)
Sex Offenders
According to our data, there are 2,628 registered sex offenders living in Memphis and 157 registered sex offenders living in . The ratio of residents to sex offenders in Memphis is 248 to 1; the ratio in Huntsville is 1,250 to 1. The number of registered sex offenders compared to the number of residents is much larger in Memphis than that in Huntsville.
Cost of Living
The cost of living in Huntsville is significantly lower than Memphis. This is largely contributed by lower housing costs. However, Memphis offers affordable utilities and healthcare. For tourists, both cities offer a range of cost-effective activities and accommodations, making them appealing destinations.
Income Tax
Interestingly, Tennessee has no state income tax, making Memphis attractive for those looking for tax savings. Alabama, however, imposes state income tax, which affects Huntsville residents.
Property Tax
Property taxes in both cities vary based on the assessed value of the property. However, Memphis generally has higher property tax rates compared to Huntsville.
Sales Tax
Tennessee's state sales tax rate is higher at 7% than Alabama's which is 4%. However, the total sales tax rate in Memphis, which includes local tax, is notably higher than Huntsville's.
Income
Type
Memphis
Huntsville
Estimated median household income
$44,317
$70,757
Estimated per capita income
$28,571
$42,232
Cost of living index (U.S. average is 100)
85.5
83.8
If you make $50,000 in Huntsville, you will have to make $51,014 in Memphis to maintain the same standard of living.
Geographical Conditions
Memphis, located near the Mississippi River, is known for its flat terrain adorned with parks, while Huntsville, located in the Tennessee River Valley, is surrounded by rolling hills and close to several mountains, offering numerous outdoor activities.
Both cities have a decent education system. Huntsville, home to the University of Alabama, has a stronger focus on science and technology education due to its thriving tech industry. Memphis boasts a large school district with numerous higher-learning institutions like University of Memphis and Rhodes College.
Memphis has a diversified economy with strong sectors in transportation, healthcare, and education. FedEx, International Paper, and AutoZone are some of the major employers in the city. Huntsville, also known as "Rocket City," is a significant hub for the aerospace and defense industries, with high tech jobs provided by NASA's Marshall Space Flight Center and Cummings Research Park.
Biggest Employers
In Memphis, FedEx, International Paper, and AutoZone are some of the biggest employers. In contrast, in Huntsville, the largest employers are NASA's Marshall Space Flight Center, Redstone Arsenal, and Huntsville Hospital.
In Memphis (Shelby County), 62.9% voted for Democrats and 36.7% for Republicans in 2012 Presidential Election. In Huntsville (Madison County), 40.2% voted for Democrats and 58.9% for Republicans.
Elections
Type
Democrats
Republicans
Other
Year
Memphis
Huntsville
Memphis
Huntsville
Memphis
Huntsville
2020
64.8%
44.8%
34.2%
52.8%
1.1%
2.4%
2016
62.3%
38.4%
34.7%
54.8%
3.1%
6.8%
2012
62.9%
40.2%
36.7%
58.9%
0.4%
1.0%
2008
63.8%
41.9%
36.2%
56.9%
0.0%
1.2%
2004
57.7%
40.2%
42.0%
59.0%
0.3%
0.8%
2000
56.8%
42.6%
42.3%
54.9%
0.9%
2.5%
1996
78.9%
41.9%
19.6%
50.0%
1.5%
8.1%
Breakdown of population affiliated with a religious congregation
Type
Adherents
Congregations
Religion
Memphis
Huntsville
Memphis
Huntsville
SOUTHERN BAPTIST CONVENTION
14.8%
19.9%
15.1%
21.8%
CATHOLIC CHURCH
6.5%
4.2%
2.7%
1.4%
EVANGELICAL PRESBYTERIAN CHURCH
1.5%
0.1%
0.7%
0.2%
EPISCOPAL CHURCH
0.8%
1.0%
1.8%
1.4%
MUSLIM ESTIMATE
0.5%
0.3%
0.8%
0.7%
LUTHERAN CHURCH
0.4%
0.3%
1.0%
1.2%
PRESBYTERIAN CHURCH IN AMERICA
0.4%
0.7%
0.6%
1.4%
SEVENTH DAY ADVENTIST CHURCH
0.4%
1.9%
0.9%
2.5%
AMERICAN BAPTIST CHURCHES IN THE USA
0.3%
0.6%
0.6%
0.2%
EVANGELICAL LUTHERAN CHURCH IN AMERICA
0.1%
0.5%
0.4%
0.9%
Weather
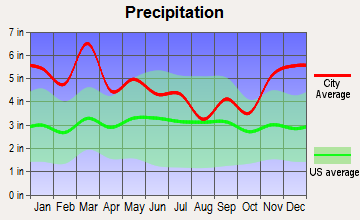
Memphis enjoys four distinct seasons with hot, humid summers and mild winters. Rainfall is consistent throughout the year, sometimes leading to thunderstorms. Huntsville, although also experiencing four seasons, has less humid summers and slightly chillier winters. Both cities are prone to tornadoes, with Huntsville having more incidents due to its close proximity to "Tornado Alley".
Weather and climate
Type
Memphis
Huntsville
Temperature - Average
61.9°F
60.2°F
Humidity - Average morning or afternoon humidity
74%
76.7%
Humidity - Differences between morning and afternoon humidity
33%
39%
Humidity - Maximum monthly morning or afternoon humidity
85%
90%
Humidity - Minimum monthly morning or afternoon humidity
52%
51%
Precipitation - Yearly average
54.3 in
56.7 in
Snowfall - Yearly average
8.6 in
7.2 in
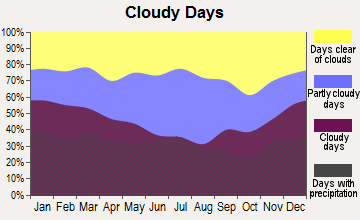
Clouds - Number of days clear of clouds
19.7%
16.7%
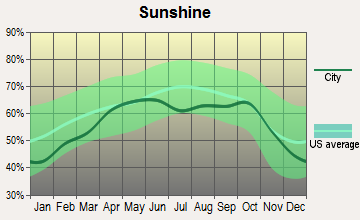
Sunshine amount - Average
68.7%
60.9%
Sunshine amount - Differences during a year
24%
20.2%
Sunshine amount - Maximum monthly
74%
64.5%
Sunshine amount - Minimum monthly
50%
44.3%
Wind speed - Average
8.8 mph
7.8 mph
Average climate in Memphis, Tennessee
Average climate in Huntsville, Alabama
Air pollution
Type
AQI
CO
NO2
OZONE
PM10
PM25
SO2
Year
Memphis
Huntsville
Memphis
Memphis
Huntsville
Memphis
Huntsville
Memphis
Memphis
Huntsville
Memphis
Huntsville
2018
81
66
0.24
N/A
10.4
N/A
27.1
31.9
19.0
N/A
8.1
9.3
0.4
N/A
2017
74
60
0.24
N/A
10.2
N/A
28.1
30.4
17.5
N/A
7.9
6.7
0.3
N/A
2016
76
74
0.24
N/A
10.2
N/A
28.8
33.4
19.6
N/A
8.5
7.8
0.9
N/A
2015
77
67
0.26
N/A
11.1
N/A
26.9
30.2
N/A
N/A
9.2
7.7
1.0
N/A
2014
75
60
0.27
N/A
10.1
N/A
26.5
31.5
N/A
N/A
9.9
N/A
1.3
N/A
2013
74
60
0.31
N/A
8.3
N/A
26.6
32.5
N/A
N/A
10.2
N/A
1.0
N/A
2012
94
81
0.32
N/A
9.3
N/A
29.7
34.0
N/A
N/A
10.7
N/A
0.6
N/A
2011
93
82
0.34
N/A
10.0
N/A
29.0
33.9
N/A
N/A
11.1
N/A
0.5
N/A
2010
95
82
0.43
N/A
10.3
N/A
27.9
32.4
N/A
N/A
12.9
11.1
N/A
N/A
2009
86
73
0.35
N/A
8.7
N/A
24.9
31.3
N/A
N/A
11.8
12.2
N/A
N/A
2008
94
70
0.36
N/A
10.3
N/A
26.3
30.4
N/A
N/A
13.2
N/A
N/A
N/A
2007
106
85
0.47
N/A
11.2
N/A
26.7
32.1
N/A
N/A
14.8
N/A
5.6
N/A
2006
108
84
0.43
N/A
13.0
N/A
26.8
31.1
N/A
N/A
14.7
N/A
6.3
N/A
2005
110
81
0.46
N/A
10.1
N/A
26.9
28.6
N/A
N/A
17.9
N/A
4.9
N/A
2004
98
80
0.51
N/A
N/A
N/A
24.9
28.1
N/A
N/A
14.5
N/A
5.9
N/A
2003
110
82
0.57
N/A
20.1
5.3
25.3
27.5
N/A
N/A
15.0
N/A
5.8
1.6
2002
110
83
0.58
N/A
20.4
N/A
25.1
26.6
15.6
N/A
N/A
N/A
4.5
N/A
2001
111
80
0.66
N/A
24.7
N/A
26.0
27.3
22.7
N/A
N/A
N/A
6.1
N/A
2000
103
95
0.63
N/A
25.2
N/A
26.2
29.5
24.9
N/A
N/A
N/A
6.4
N/A
Natural disasters
Type
Memphis
Huntsville
Tornado activity compared to U.S. average
198.6%
246.2%
Earthquake activity compared to U.S. average
474%
262.1%
Natural disasters compared to U.S. average
18%
17%
Transportation
Memphis offers various transportation options, including MATA buses, trolleys, and Amtrak. It is also noted for its bike-sharing program. Huntsville, however, primarily relies on personal vehicles, although it does have a public bus service (Shuttle Bus) and rideshares.
Transport
Type
Memphis
Huntsville
Amtrak stations
1
0
Amtrak stations nearby
1
0
FAA registered aircraft
1
280
FAA registered aircraft manufacturers and dealers
52
5
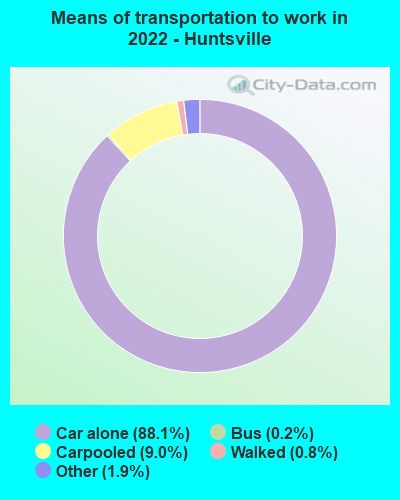
Means of transportation to work
Type
Memphis
Huntsville
Bus
0.4%
0.2%
Carpooled
7.5%
6.5%
Car alone
88.8%
91.5%
Taxicab
0.1%
0.2%
Walked
1.2%
0.9%
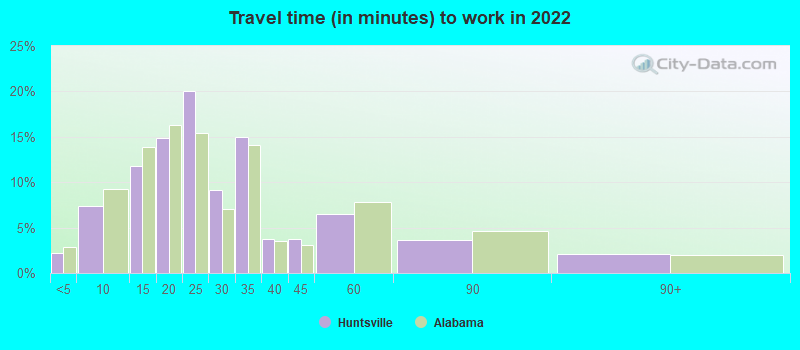
Average travel time to work
Type
Memphis
Huntsville
Average
27 min
28.5 min
Other means
22.5 min
19.3 min
Public transportation
43.5 min
31.7 min
Private vehicle occupancy
Type
Memphis
Huntsville
Average
1.1
1.1
Drove alone
89.9%
93.2%
In 2 person carpool
7.9%
4.7%
In 3 person carpool
1.6%
1.3%
In 4 person carpool
0.4%
0.6%
In 5-6 person carpool
0.2%
0.2%
How many people usually rode to work in the car, truck or van.
Real Estate
The real estate market in both cities is relatively affordable. However, Huntsville's real estate is cheaper than Memphis's. While Memphis has a rich heritage reflected in its historical homes, Huntsville offers a mix of traditional and modern homes.
Neighborhoods
Memphis offers a mix of diverse neighborhoods such as the artsy Cooper-Young, historic Central Gardens, and affluent East Memphis. Huntsville, on the other hand, offers family-friendly areas like Hampton Cove, the trendy Five Points, and the historic Twickenham district.
Houses and residents
Type
Memphis
Huntsville
Houses
288,491
104,141
Average household size (people)
2.5
2.3
Median year apartment built
1972
1985
Median year house/condo built
1967
1983
Length of stay in the house since moving in
16.2 years
12.6 years
Houses occupied
256,968 (89.1%)
96,551 (92.7%)
Houses occupied by owners
119,622 (46.6%)
59,015 (61.1%)
Houses occupied by renters
137,346 (53.4%)
37,536 (38.9%)
Median rent asked for vacant for-rent units
$760.83
$1,286
Median monthly housing costs
$967
$935
Median price asked for vacant for-sale houses and condos
$201,932
$246,721
Estimated median house or condo value
$142,800
$250,400
Median numbers of rooms
5.5
6
Median number of rooms in apartments
4.8
4.3
Median number of rooms in houses and condos
6.6
7.3
Median house price - detached houses
$205,904
$257,633
Median house price - in 2-unit structures
Over $1,000,000
$66,368
Median house price - in 3-to-4-unit structures
$145,165
$111,845
Median house price - in 5 or more unit structures
$201,411
$246,169
Median house price - mobile homes
$93,577
$113,555
Median house price - occupied boats, rvs, vans etc.
$39,582
$12,217
Median house price - Townhouses or other attached units
$170,154
$196,303
Median house price - All housing units
$204,886
$253,177
Median house age
52
39
Renting percentage
48.1%
42%
Housing density (houses/condos per square mile)
1,032.8
598.4
House value disparities
44.1%
36.8%
Household income disparities
48.2%
45%
Median household income for houses/condes with a mortgage
$72,611
$100,571
Median household income for apartments without a mortgage
$53,615
$69,689
Housing units without a mortgage
1,461 (2%)
806 (2.3%)
Housing units with both a second mortgage and home equity loan
3,970 (5.4%)
2,456 (6.9%)
Housing units with a mortgage
71,386 (98%)
35,004 (97.7%)
Housing units with a home equity loan
322 (0.4%)
0 (0%)
Housing units with a second mortgage
5,907 (8.1%)
2,651 (7.4%)
House/condo owner moved in on average (years ago)
16
10
House/condo renter moved in on average (years ago)
1
1
Housing units lacking complete kitchen facilities
5.7%
2%
Housing units lacking complete plumbing facilities
4.6%
1.1%
Housing units in structures
Housing units in structures
Memphis
Huntsville
One, detached
61.0%
67.1%
One, attached
5.8%
3.5%
Two
2.1%
2.0%
3 or 4
7.4%
5.2%
5 to 9
9.1%
6.3%
10 to 19
5.6%
6.6%
20 to 49
1.8%
3.2%
50 or more
6.2%
5.3%
Mobile homes
0.8%
0.9%
Boats, RVs, vans, etc.
0.1%
0.0%
Median real estate property taxes paid for housing units
Self-employed workers in own not incorporated business
16,111
5,111
State government workers
7,650
4,814
Unpaid family workers
668
668
Industries and Occupations
The Memphis economy is driven by industries like transportation, healthcare, and services, while in Huntsville, the economy revolves around aerospace, defense, IT, and biotechnology. Thus, occupations in Memphis range from healthcare professionals to logistics personnel, while in Huntsville, the majority of jobs are in the engineering, technology, and scientific fields.
Both cities offer reliable healthcare with internationally recognized hospitals. Memphis is home to top-tier hospitals like Baptist Memorial and Methodist Hospitals. Huntsville Hospital is the main healthcare provider in Huntsville, alongside Crestwood Medical Center.
Health (county statistics)
Type
Memphis
Huntsville
General health status score of residents in this county from 1 (poor) to 5 (excellent)
Memphis has experienced significant infrastructure development over the years. Its airport is home to FedEx's superhub, contributing to its reputation as the second busiest cargo airport globally. Huntsville is known for its robust road network and easy accessibility. The city is also investing in downtown revitalization and infrastructure projects like greenways and parks.
Infrastructure
Type
Memphis
Huntsville
Hospitals
35
10
TV stations
14
9
Arenas or stadiums
2
1
Bank branches located here
160
62
Bank institutions located here
33
20
Main business address for public companies
17
3
Drinking water stations with no reported violations in the past
0
3
Drinking water stations with reported violations in the past
HMDA - Conventional home purchase loans - Applications denied
Year
Memphis
Huntsville
1999
2,195
536
2000
2,406
393
2001
1,775
234
2002
1,444
259
2003
2,116
261
2004
3,266
393
2005
4,730
556
2006
5,833
607
2007
3,559
425
2008
1,174
178
2009
345
104
Culture and Food
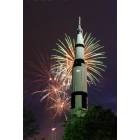
Memphis boasts a rich cultural history, especially known for blues, rock n' roll, and BBQ. It offers a mix of museums, music festivals, and delicious Southern cuisine. Huntsville, although smaller, also offers diverse dining options, craft breweries, and engaging museums, including the famous U.S. Space & Rocket Center.
Sports Teams
Memphis is home to several professional sports teams including the NBA’s Grizzlies and the minor league baseball team, Redbirds. Huntsville, in contrast, doesn't have professional sports teams but hosts minor league baseball in the form of the Rocket City Trash Pandas.


 Memphis, TN
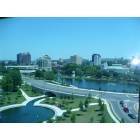
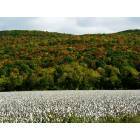
 Huntsville, AL