Memphis, TN and St. Paul, MN, both hold unique values and opportunities. The southern charm of Memphis contrasts notably to the northern culture of St. Paul. Both cities have their own strengths and challenges in terms of crime, weather, cost of living, education, and other key areas. An individual's decision to settle in either city would largely depend on one's personal preferences and lifestyle choices. From the rhythmic music scenes to the diverse climate conditions, both cities offer different experiences for both locals and tourists.
Distance between
Memphis, TN and
St. Paul, MN : 699.5 miles
Memphis's population is larger by 105%. Its population has decreased by 21,973 people (3.4%) since 2000. The population of St. Paul has grown by 20,042 people (7.0%) during that time.
Compared to St. Paul, Memphis registers a significantly higher crime rate, which could be a point of concern to potential residents and tourists. Both cities have made remarkable strides in championing for community policing to enhance safety. However, St. Paul is frequently rated as one of the safest cities in the US. Both city administrations have concrete strategies in place to combat crime and ensure safety.
City-data.com crime index counts serious crimes and violent crime more heavily. It adjusts for the number of visitors and daily workers commuting into cities. (higher means more crime, U.S. average = 301.1)
City-data.com crime index counts serious crimes and violent crime more heavily. It adjusts for the number of visitors and daily workers commuting into cities. (higher means more crime, U.S. average = 301.1)
Sex Offenders
According to our data, there are 2,629 registered sex offenders living in Memphis and 90 registered sex offenders living in . The ratio of residents to sex offenders in Memphis is 248 to 1; the ratio in St. Paul is 3,360 to 1. The number of registered sex offenders compared to the number of residents is much larger in Memphis than that in St. Paul.
Cost of Living
Memphis boasts a relatively lower cost of living compared to national averages, making it an attractive option for those looking for affordability. In contrast, the cost of living in St. Paul, though not exorbitant, is slightly higher than the national average – a factor mainly linked to higher housing costs.
Income Tax
Minnesota imposes a state income tax that can be relatively high compared to other states. However, Tennessee, including Memphis, does not levy a state income tax.
Property Tax
The effective property tax rate in Memphis is slightly higher than in St. Paul, an aspect potential homeowners may consider when comparing the two cities.
Sales Tax
Tennessee, which includes Memphis, has one of the highest sales tax rates in the US, while Minnesota's sales tax is considerably lower, making goods and services slightly cheaper in St. Paul.
Income
Type
Memphis
St. Paul
Estimated median household income
$44,317
$66,098
Estimated per capita income
$28,571
$36,313
Cost of living index (U.S. average is 100)
85.5
114.5
If you make $50,000 in Memphis, you will have to make $66,959 in St. Paul to maintain the same standard of living.
Geographical Conditions
Memphis, situated on the Mississippi River, has a more flat landscape. St. Paul, juxtaposed against the Mississippi River, has more hilly terrains and a large number of lakes and parks.
Several top-notch educational institutions grace St. Paul. The Saint Paul Public School District is the largest in the state and has numerous National Blue Ribbon Schools. Memphis, too, offers quality education, especially higher education, with over 20 colleges and universities, including the renowned University of Memphis.
Memphis primarily focuses its economy around transportation and shipping, given its location along the Mississippi River. On the other hand, St. Paul diversifies across sectors, with many big companies in healthcare, insurance, and finance sectors choosing to set up their headquarters there.
Biggest Employers
The biggest employers in St. Paul include UnitedHealth Group, U.S. Bancorp, and Target. In Memphis, major employers are FedEx, International Paper, and AutoZone.
In Memphis (Shelby County), 62.9% voted for Democrats and 36.7% for Republicans in 2012 Presidential Election. In St. Paul (Ramsey County), 66.6% voted for Democrats and 31.2% for Republicans.
Elections
Type
Democrats
Republicans
Other
Year
Memphis
St. Paul
Memphis
St. Paul
Memphis
St. Paul
2020
64.8%
71.8%
34.2%
26.3%
1.1%
1.9%
2016
62.3%
65.2%
34.7%
26.0%
3.1%
8.8%
2012
62.9%
66.6%
36.7%
31.2%
0.4%
2.2%
2008
63.8%
66.2%
36.2%
32.2%
0.0%
1.6%
2004
57.7%
63.5%
42.0%
35.9%
0.3%
0.7%
2000
56.8%
57.0%
42.3%
36.1%
0.9%
7.0%
1996
78.9%
58.7%
19.6%
29.3%
1.5%
12.0%
Breakdown of population affiliated with a religious congregation
Type
Adherents
Congregations
Religion
Memphis
St. Paul
Memphis
St. Paul
SOUTHERN BAPTIST CONVENTION
14.8%
0.2%
15.1%
1.8%
CATHOLIC CHURCH
6.5%
24.5%
2.7%
11.5%
EVANGELICAL PRESBYTERIAN CHURCH
1.5%
0.0%
0.7%
0.0%
EPISCOPAL CHURCH
0.8%
1.1%
1.8%
3.2%
MUSLIM ESTIMATE
0.5%
0.8%
0.8%
1.3%
LUTHERAN CHURCH
0.4%
1.4%
1.0%
3.7%
PRESBYTERIAN CHURCH IN AMERICA
0.4%
0.0%
0.6%
0.3%
SEVENTH DAY ADVENTIST CHURCH
0.4%
0.1%
0.9%
1.6%
AMERICAN BAPTIST CHURCHES IN THE USA
0.3%
0.7%
0.6%
3.4%
EVANGELICAL LUTHERAN CHURCH IN AMERICA
0.1%
7.8%
0.4%
14.2%
SALVATION ARMY
0.0%
0.4%
0.2%
0.8%
WISCONSIN EVANGELICAL LUTHERAN SYNOD
0.0%
0.6%
0.1%
2.1%
Weather
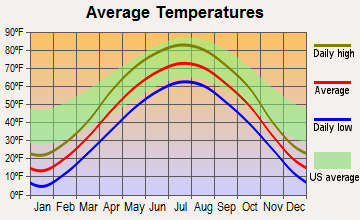
In terms of weather, Memphis offers a milder climate compared to St. Paul. While Memphis mostly enjoys a humid subtropical climate, St. Paul experiences a hot summer humid continental climate – with extremely cold winters that may not suit everyone's taste.
Weather and climate
Type
Memphis
St. Paul
Temperature - Average
61.9°F
45.6°F
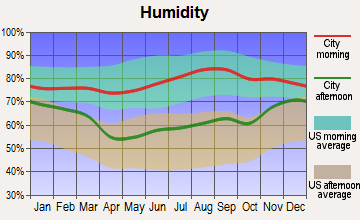
Humidity - Average morning or afternoon humidity
74%
74.9%
Humidity - Differences between morning and afternoon humidity
33%
33%
Humidity - Maximum monthly morning or afternoon humidity
85%
84%
Humidity - Minimum monthly morning or afternoon humidity
52%
51%
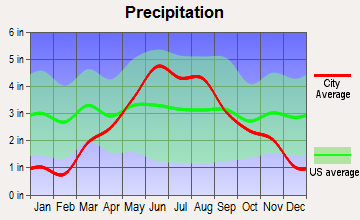
Precipitation - Yearly average
54.3 in
31.8 in
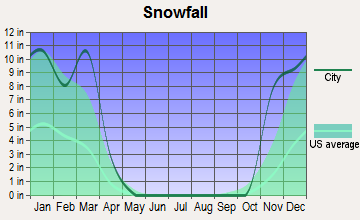
Snowfall - Yearly average
8.6 in
98.6 in
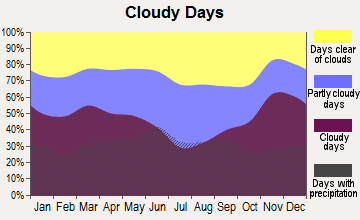
Clouds - Number of days clear of clouds
19.7%
15.8%
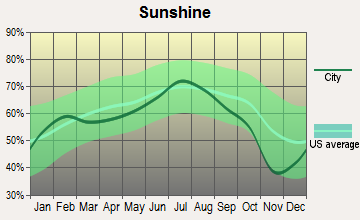
Sunshine amount - Average
68.7%
61.8%
Sunshine amount - Differences during a year
24%
37%
Sunshine amount - Maximum monthly
74%
74%
Sunshine amount - Minimum monthly
50%
37%
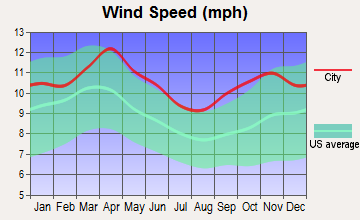
Wind speed - Average
8.8 mph
10.5 mph
Average climate in Memphis, Tennessee
Average climate in St. Paul, Minnesota
Air pollution
Type
AQI
CO
NO2
OZONE
PB
PM10
PM25
SO2
Year
Memphis
St. Paul
Memphis
St. Paul
Memphis
St. Paul
Memphis
St. Paul
St. Paul
Memphis
St. Paul
Memphis
St. Paul
Memphis
St. Paul
2018
81
81
0.24
0.24
10.4
11.6
27.1
28.2
N/A
N/A
19.0
20.4
8.1
8.5
0.4
1.0
2017
74
71
0.24
0.26
10.2
11.9
28.1
27.9
N/A
N/A
17.5
19.5
7.9
7.5
0.3
1.2
2016
76
76
0.24
0.28
10.2
11.2
28.8
26.7
N/A
N/A
19.6
18.2
8.5
6.8
0.9
1.2
2015
77
80
0.26
0.28
11.1
12.4
26.9
27.8
N/A
N/A
N/A
21.3
9.2
7.5
1.0
1.0
2014
75
83
0.27
0.25
10.1
14.2
26.5
26.8
N/A
N/A
N/A
23.1
9.9
8.1
1.3
0.9
2013
74
81
0.31
N/A
8.3
11.6
26.6
32.1
N/A
N/A
N/A
22.6
10.2
7.2
1.0
0.9
2012
94
80
0.32
N/A
9.3
7.7
29.7
29.0
N/A
N/A
N/A
25.6
10.7
8.3
0.6
0.2
2011
93
90
0.34
0.22
10.0
7.8
29.0
30.1
N/A
N/A
N/A
25.4
11.1
10.0
0.5
0.3
2010
95
101
0.43
N/A
10.3
9.6
27.9
28.3
0.002
N/A
N/A
24.7
12.9
11.1
N/A
0.5
2009
86
103
0.35
N/A
8.7
7.4
24.9
N/A
0.002
N/A
N/A
21.4
11.8
11.0
N/A
1.1
2008
94
92
0.36
N/A
10.3
8.8
26.3
N/A
0.004
N/A
N/A
18.3
13.2
11.0
N/A
1.0
2007
106
102
0.47
N/A
11.2
9.2
26.7
N/A
0.004
N/A
N/A
21.6
14.8
11.4
5.6
0.6
2006
108
88
0.43
N/A
13.0
9.5
26.8
N/A
0.007
N/A
N/A
20.5
14.7
10.4
6.3
1.2
2005
110
107
0.46
N/A
10.1
12.3
26.9
N/A
0.004
N/A
N/A
22.0
17.9
12.1
4.9
1.5
2004
98
103
0.51
N/A
N/A
11.0
24.9
N/A
0.004
N/A
N/A
23.9
14.5
11.9
5.9
2.3
2003
110
114
0.57
N/A
20.1
12.5
25.3
N/A
0.004
N/A
N/A
25.9
15.0
13.0
5.8
2.2
2002
110
95
0.58
0.42
20.4
15.7
25.1
N/A
0.006
N/A
15.6
N/A
N/A
11.1
4.5
1.1
2001
111
82
0.66
0.75
24.7
17.5
26.0
32.4
0.011
N/A
22.7
N/A
N/A
9.3
6.1
1.1
2000
103
68
0.63
0.75
25.2
16.6
26.2
31.2
0.009
N/A
24.9
N/A
N/A
N/A
6.4
1.4
Natural disasters
Type
Memphis
St. Paul
Tornado activity compared to U.S. average
198.6%
129.5%
Earthquake activity compared to U.S. average
474%
43.1%
Natural disasters compared to U.S. average
18%
18%
Transportation
Both cities demonstrate developed transportation networks. St. Paul offers a higher public transit system marked by efficient bus services and light rail lines, while Memphis offers regular bus services and a couple of rail options.
Transport
Type
Memphis
St. Paul
Amtrak stations
1
1
Amtrak stations nearby
1
1
FAA registered aircraft
1
0
FAA registered aircraft manufacturers and dealers
52
0
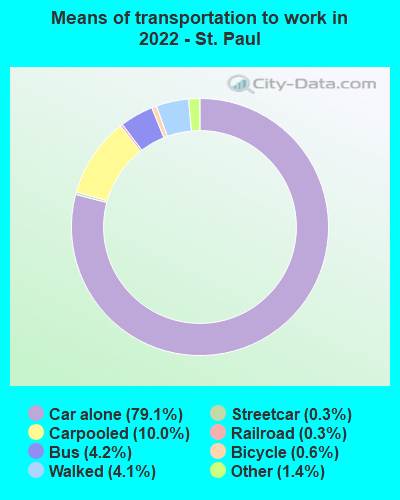
Means of transportation to work
Type
Memphis
St. Paul
Bicycle
0%
1%
Bus
0.4%
4.4%
Carpooled
7.5%
9.4%
Car alone
88.8%
79.9%
Railroad
0%
0.2%
Taxicab
0.1%
0.2%
Walked
1.2%
3.7%
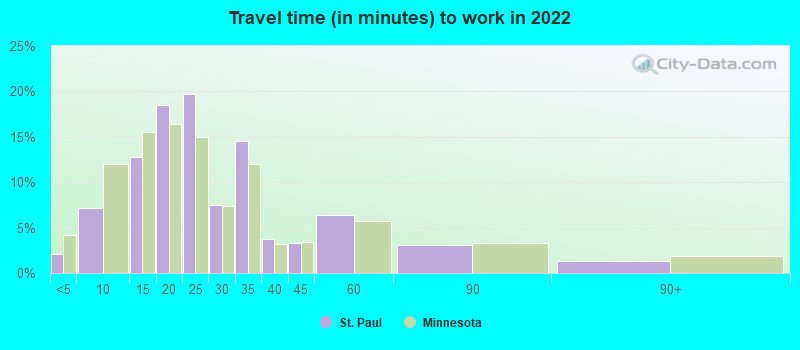
Average travel time to work
Type
Memphis
St. Paul
Average
27 min
25.8 min
Other means
22.5 min
20.7 min
Public transportation
43.5 min
34.4 min
Private vehicle occupancy
Type
Memphis
St. Paul
Average
1.1
1.2
Drove alone
89.9%
87.5%
In 2 person carpool
7.9%
9.4%
In 3 person carpool
1.6%
2%
In 4 person carpool
0.4%
0.6%
In 5-6 person carpool
0.2%
0.1%
In 7+ person carpool
0.1%
0.3%
How many people usually rode to work in the car, truck or van.
Real Estate
When it comes to real estate, Memphis tends to be much cheaper, with lower property prices. In contrast, St. Paul is part of the Twin Cities, making the real estate market lively, albeit with higher real estate costs.
Neighborhoods
Each city has varied neighborhoods with distinct characteristics. Neighborhoods in Memphis like Cooper-Young and East Memphis are known for their vibrant arts scene and food culture. St. Paul has neighborhoods like Macalester-Groveland and Como Park, valued for their community feel and recreational opportunities.
Houses and residents
Type
Memphis
St. Paul
Houses
288,491
131,275
Average household size (people)
2.5
2.5
Median year apartment built
1972
1966
Length of stay in the house since moving in
16.2 years
12.8 years
Houses occupied
256,968 (89.1%)
121,964 (92.9%)
Houses occupied by owners
119,622 (46.6%)
67,642 (55.5%)
Houses occupied by renters
137,346 (53.4%)
54,322 (44.5%)
Median rent asked for vacant for-rent units
$760.83
$1,437
Median monthly housing costs
$967
$1,207
Median price asked for vacant for-sale houses and condos
$201,932
$431,254
Estimated median house or condo value
$142,800
$267,700
Median numbers of rooms
5.5
5.1
Median number of rooms in apartments
4.8
3.7
Median number of rooms in houses and condos
6.6
6.5
Median house price - detached houses
$205,904
$311,442
Median house price - in 2-unit structures
Over $1,000,000
$296,942
Median house price - in 3-to-4-unit structures
$145,165
$253,376
Median house price - in 5 or more unit structures
$201,411
$282,309
Median house price - Townhouses or other attached units
$170,154
$352,916
Median house price - All housing units
$204,886
$309,562
Median house age
52
67
Renting percentage
48.1%
48.7%
Housing density (houses/condos per square mile)
1,032.8
2,487.8
House value disparities
44.1%
29.1%
Household income disparities
48.2%
44.1%
Median household income for houses/condes with a mortgage
$72,611
$95,328
Median household income for apartments without a mortgage
$53,615
$76,318
Housing units without a mortgage
1,461 (2%)
934 (1.9%)
Housing units with both a second mortgage and home equity loan
3,970 (5.4%)
3,112 (6.5%)
Housing units with a mortgage
71,386 (98%)
47,031 (98.1%)
Housing units with a home equity loan
322 (0.4%)
441 (0.9%)
Housing units with a second mortgage
5,907 (8.1%)
4,559 (9.5%)
House/condo owner moved in on average (years ago)
16
10
House/condo renter moved in on average (years ago)
1
2
Housing units lacking complete kitchen facilities
5.7%
1.2%
Housing units lacking complete plumbing facilities
4.6%
0.2%
Housing units in structures
Housing units in structures
Memphis
St. Paul
One, detached
61.0%
50.0%
One, attached
5.8%
3.7%
Two
2.1%
6.4%
3 or 4
7.4%
4.0%
5 to 9
9.1%
4.9%
10 to 19
5.6%
6.0%
20 to 49
1.8%
7.5%
50 or more
6.2%
17.2%
Mobile homes
0.8%
0.2%
Boats, RVs, vans, etc.
0.1%
0.0%
Median real estate property taxes paid for housing units
Self-employed workers in own not incorporated business
16,111
6,217
State government workers
7,650
9,418
Unpaid family workers
668
0
Industries and Occupations
St. Paul's diversified economy provides job opportunities in education, healthcare, and professional services. Minneapolis-St. Paul metro area is a significant hub for major corporations. Memphis, on the other hand, has a robust industry focus on shipping, transportation and has a vibrant music industry.
Both cities offer quality health care, with St. Paul boasting renowned health facilities like Regions Hospital and United Hospital. Memphis is home to Baptist Memorial Hospital and St. Jude Children's Research Hospital, recognized nationally for their high-quality medical services.
Health (county statistics)
Type
Memphis
St. Paul
General health status score of residents in this county from 1 (poor) to 5 (excellent)
Infrastructure-wise, both cities showcase strengths and improvements. Memphis, for instance, boasts the Memphis International Airport, one of the busiest cargo airports globally. On the other hand, St. Paul is renowned for its well-developed river-based transportation believed to boost its trade.
Infrastructure
Type
Memphis
St. Paul
TV stations
14
18
Arenas or stadiums
2
1
Bank branches located here
160
12
Bank institutions located here
33
8
Drinking water stations with no reported violations in the past
0
2
Drinking water stations with reported violations in the past
HMDA - Conventional home purchase loans - Applications denied
Year
Memphis
St. Paul
1999
2,195
808
2000
2,406
747
2001
1,775
597
2002
1,444
577
2003
2,116
841
2004
3,266
1,156
2005
4,730
1,803
2006
5,833
1,781
2007
3,559
1,123
2008
1,174
467
2009
345
216
Culture and Food
Memphis is renowned for its music scene, especially the blues, and its southern comfort food. St. Paul, on the other hand, has a multicultural identity with many music festivals, literary events, and varied cuisine offerings, including the famous 'Jucy Lucy' burger.
Sports Teams
For sports enthusiasts, St. Paul is home to the Minnesota Wild (NHL) and share MLB, NFL, and NBA teams with Minneapolis. Memphis has the Grizzlies (NBA) and a passionate college basketball scene with the Memphis Tigers.


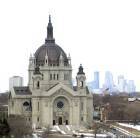
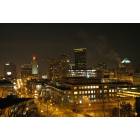

 Memphis, TN
 St. Paul, MN