This comparative analysis puts a spotlight on Milwaukee, Wisconsin, versus Staten Island, New York, taking into account factors that are important for people choosing to relocate or visit. This analysis studies features such as crime and safety, weather, cost of living, education, work and economy, infrastructure, industries and occupations, biggest employers, real-estate, neighborhoods, transportation, taxation, cultural aspects, sports, geographical conditions, and healthcare services.
When considering the safety aspect, Staten Island, part of the five boroughs of New York City, generally sees lower crime rates than Milwaukee. Crime ranks notably higher in Milwaukee in both violent and property crimes. For individuals thinking of relocation or visiting, a critical examination of community crime statistics is essential. Both cities offer several safe neighborhoods; however, Milwaukee does have areas of considerable concern due to higher crime prevalence.
Cost of Living
For those considering the cost of living, Milwaukee offers a more affordable lifestyle compared to Staten Island. Factors such as housing, utilities, groceries, and healthcare are typically cheaper in Milwaukee. While Staten Island is the least expensive borough in New York City, it's still quite a bit more expensive than many American cities, Milwaukee included.
Income Tax
There is also a stark difference in income tax between the two cities. Wisconsin's top marginal income tax rate is 7.65%, with New York's maximum state income tax reaching up to 8.82%. New York City residents also face additional city tax rates not present for Milwaukee residents.
Property Tax
Property tax rates in Milwaukee are considerably higher than those in Staten Island. The average property tax rate in Milwaukee is amongst the highest in the country. Conversely, Staten Island's rates are on the lower end for the New York City area.
Sales Tax
Milwaukee residents see a lower sales tax than those living on Staten Island. Wisconsin's statewide sales tax is 5%, with Milwaukee adding a 0.6% county tax. In contrast, New York has a statewide sales tax rate of 4%, and New York City adds an additional 4.5%, making Staten Island's total sales tax 8.5%.
Income
Type
Milwaukee
Staten Island
Estimated median household income
$46,637
$86,054
Estimated per capita income
$26,998
$38,678
Cost of living index (U.S. average is 100)
97.5
164.1
If you make $50,000 in Milwaukee, you will have to make $84,154 in Staten Island to maintain the same standard of living.
Geographical Conditions
Geographically, Milwaukee is known for its lakefront and riverwalk, which provides breathtaking views and outdoor activities. Staten Island, the greenest of the New York City boroughs, boasts a variety of parks and coastline beaches, offering a semi-suburban character within a major metropolis.
Geographical information
Type
Milwaukee
Staten Island
Land area
96.1 sq. miles
58.5 sq. miles
Population density
5,926.6 people per sq. mile
8,225.7 people per sq. mile
Relative area comparison
Milwaukee, WI Staten Island, NY
Education
Education offerings in both cities are robust. Milwaukee has a good mix of public and private schools and is home to several universities, including Marquette University and the University of Wisconsin-Milwaukee. Staten Island also has a range of public, private, and charter schools, plus higher education facilities like the College of Staten Island, St. John’s University, and Wagner College.
The work and economy sector of both cities differ significantly. Milwaukee is known for its manufacturing sector, while Staten Island has a more diversified economy with sectors such as healthcare, retail trade, and education being dominant. Job growth for both cities is seen across various sectors for the future.
Biggest Employers
In Milwaukee, major employers include healthcare and social assistance providers such as Aurora Health Care, Ascension Wisconsin, and Froedtert. Whereas, in Staten Island, local government hires many residents, followed by the trade, transportation, and utilities industries.
In Milwaukee (Milwaukee County), 67.8% voted for Democrats and 31.6% for Republicans in 2012 Presidential Election. In Staten Island (Richmond County), 50.8% voted for Democrats and 48.3% for Republicans.
Elections
Type
Democrats
Republicans
Other
Year
Milwaukee
Staten Island
Milwaukee
Staten Island
Milwaukee
Staten Island
2020
69.3%
42.2%
29.4%
57.1%
1.3%
0.7%
2016
65.6%
41.0%
28.6%
56.1%
5.8%
2.9%
2012
67.8%
50.8%
31.6%
48.3%
0.5%
0.9%
2008
67.8%
47.8%
31.7%
51.9%
0.5%
0.4%
2004
62.0%
42.8%
37.5%
56.5%
0.5%
0.7%
2000
58.5%
52.1%
37.9%
45.1%
3.6%
2.9%
1996
58.3%
50.5%
32.2%
40.8%
9.5%
8.7%
Breakdown of population affiliated with a religious congregation
Type
Adherents
Congregations
Religion
Milwaukee
Staten Island
Milwaukee
Staten Island
CATHOLIC CHURCH
21.0%
54.2%
10.8%
20.6%
LUTHERAN CHURCH
3.0%
0.2%
5.9%
1.5%
EVANGELICAL LUTHERAN CHURCH IN AMERICA
2.4%
0.6%
6.7%
4.0%
WISCONSIN EVANGELICAL LUTHERAN SYNOD
2.2%
0.0%
6.0%
0.0%
SOUTHERN BAPTIST CONVENTION
1.3%
0.2%
4.3%
3.5%
MUSLIM ESTIMATE
1.0%
1.7%
1.1%
3.0%
AMERICAN BAPTIST CHURCHES IN THE USA
0.7%
0.6%
3.1%
1.0%
EPISCOPAL CHURCH
0.4%
0.4%
1.7%
5.0%
COPTIC ORTHODOX CHURCH
0.0%
0.5%
0.1%
1.0%
Weather
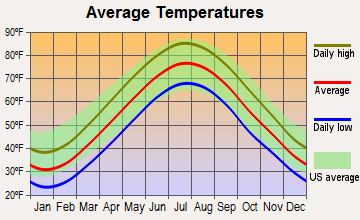
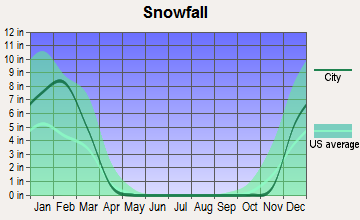
Weather is one of the main contrasts between these two cities. Milwaukee experiences a typical Midwestern climate with cold, snowy winters and warm summers. Its location on the western shore of Lake Michigan can intensify winter weather patterns. Staten Island, on the other hand, experiences a humid subtropical climate with hot, humid summers and cool to cold winters. Snowfall is less frequent and less intense than in Milwaukee.
Weather and climate
Type
Milwaukee
Staten Island
Temperature - Average
48.1°F
54.1°F
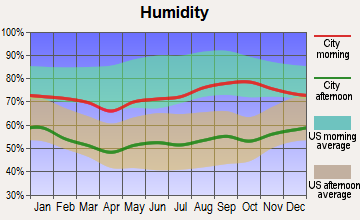
Humidity - Average morning or afternoon humidity
77%
67.4%
Humidity - Differences between morning and afternoon humidity
26%
29.9%
Humidity - Maximum monthly morning or afternoon humidity
85%
77%
Humidity - Minimum monthly morning or afternoon humidity
59%
47.2%
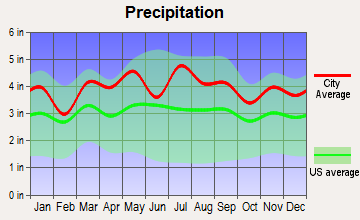
Precipitation - Yearly average
33.3 in
47.4 in
Snowfall - Yearly average
95.8 in
60 in
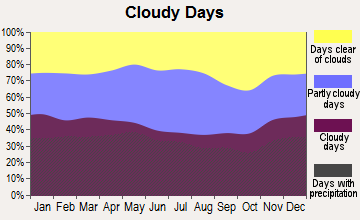
Clouds - Number of days clear of clouds
14.9%
15.8%
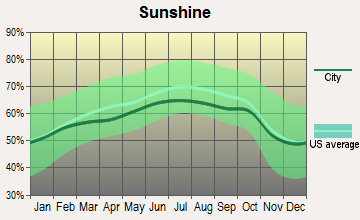
Sunshine amount - Average
57.6%
60.2%
Sunshine amount - Differences during a year
34%
20%
Sunshine amount - Maximum monthly
69%
64%
Sunshine amount - Minimum monthly
35%
44%
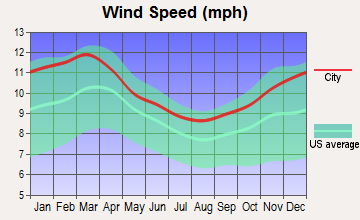
Wind speed - Average
11 mph
10.5 mph
Average climate in Milwaukee, Wisconsin
Average climate in Staten Island, New York
Air pollution
Type
AQI
CO
NO2
OZONE
PB
PM10
PM25
SO2
Year
Milwaukee
Staten Island
Milwaukee
Staten Island
Milwaukee
Staten Island
Milwaukee
Staten Island
Milwaukee
Staten Island
Milwaukee
Staten Island
Milwaukee
Staten Island
Milwaukee
Staten Island
2018
84
94
N/A
0.35
8.8
17.1
28.2
24.1
N/A
N/A
15.3
N/A
7.8
7.9
0.2
0.4
2017
80
98
N/A
0.32
8.9
17.0
27.7
27.0
N/A
N/A
14.3
N/A
6.9
7.6
0.3
0.2
2016
86
94
N/A
0.37
9.4
17.9
27.0
28.5
N/A
N/A
15.0
N/A
7.4
7.7
1.2
0.2
2015
78
102
N/A
0.39
9.6
18.9
27.2
27.3
N/A
N/A
14.9
N/A
7.8
8.6
1.1
0.4
2014
89
97
N/A
0.38
9.9
19.2
26.0
25.6
N/A
N/A
15.4
N/A
9.2
8.3
1.0
0.7
2013
81
99
N/A
0.39
10.4
19.6
26.9
27.8
N/A
N/A
15.4
N/A
9.6
8.5
0.7
0.8
2012
108
102
N/A
0.42
11.5
19.3
28.3
26.9
N/A
N/A
17.2
N/A
9.6
9.2
1.0
1.4
2011
95
108
N/A
0.42
11.4
21.4
27.3
28.1
N/A
N/A
16.2
N/A
10.1
10.2
1.2
2.0
2010
83
114
N/A
0.40
12.9
19.9
26.9
28.7
N/A
N/A
N/A
N/A
N/A
9.4
N/A
1.8
2009
69
105
N/A
0.39
12.2
22.5
23.7
25.3
N/A
N/A
N/A
N/A
N/A
9.5
N/A
2.4
2008
61
111
N/A
0.39
12.4
23.0
24.6
24.3
N/A
0.013
17.3
N/A
N/A
11.3
N/A
3.4
2007
80
123
N/A
0.44
14.2
24.2
24.1
23.3
N/A
0.016
19.9
N/A
N/A
12.0
N/A
4.3
2006
66
117
0.35
0.55
14.7
25.6
22.8
24.7
0.017
0.018
19.9
N/A
N/A
13.1
2.6
5.3
2005
99
112
0.36
0.69
16.6
27.3
25.1
23.3
0.015
N/A
25.4
N/A
N/A
N/A
3.1
7.3
2004
75
109
0.41
0.68
16.6
26.4
21.2
22.2
0.011
0.030
21.4
N/A
N/A
N/A
3.3
6.9
2003
76
112
0.41
0.76
16.7
28.0
27.1
22.1
0.017
0.006
N/A
26.9
N/A
N/A
3.3
7.1
2002
92
125
0.40
0.74
N/A
30.6
28.9
24.7
0.018
0.008
N/A
26.1
N/A
N/A
3.7
6.6
2001
96
124
0.34
0.81
15.8
32.4
28.3
24.9
0.020
0.020
N/A
26.9
N/A
N/A
3.0
7.2
2000
84
116
0.29
0.93
16.5
33.0
27.0
23.1
0.018
0.022
N/A
22.2
N/A
N/A
3.4
7.2
Natural disasters
Type
Milwaukee
Staten Island
Tornado activity compared to U.S. average
118.1%
61.3%
Earthquake activity compared to U.S. average
109.3%
31.2%
Natural disasters compared to U.S. average
19%
19%
Transportation
Both cities have comprehensive public transportation systems. Staten Island boasts the Staten Island Ferry and an extensive bus system. It's also connected to New York City's subway system. Milwaukee has a solid bus system plus the Milwaukee Hop, a modern streetcar line. The average commute in Staten Island may be longer given its proximity to Manhattan and the city's dense traffic.
Transport
Type
Milwaukee
Staten Island
Amtrak stations
1
0
Amtrak stations nearby
1
3
FAA registered aircraft
202
39
FAA registered aircraft manufacturers and dealers
1
2
Means of transportation to work
Type
Milwaukee
Staten Island
Bicycle
0.5%
0.2%
Bus
4.2%
19.2%
Carpooled
8.4%
12.1%
Car alone
81.1%
54.3%
Ferryboat
0%
5.3%
Railroad
0%
0.9%
Subway
0%
2.6%
Taxicab
0.2%
0.4%
Walked
3.9%
2.9%
Average travel time to work
Type
Milwaukee
Staten Island
Average
24.2 min
45.3 min
Real Estate
Milwaukee's real estate market is generally more affordable than Staten Island's. The median home price in Milwaukee is significantly lower than in Staten Island. Rent prices also tend to be lower in Milwaukee, making it an attractive relocation option for cost-conscious individuals.
Neighborhoods
Both cities have distinct neighborhoods, each offering unique living experiences. Neighborhoods in Milwaukee, such as the Historic Third Ward and Bay View, offer a vibrant urban lifestyle. On Staten Island, neighborhoods like St. George and Tottenville provide the appeal of suburban living with the benefits of city life nearby.
Houses and residents
Type
Milwaukee
Staten Island
Houses
257,812
163,993
Average household size (people)
2.5
2.8
Houses occupied
232,362 (90.1%)
156,341 (95.3%)
Houses occupied by owners
96,044 (41.3%)
99,732 (63.8%)
Houses occupied by renters
136,318 (58.7%)
56,609 (36.2%)
Median rent asked for vacant for-rent units
$854.05
$1,320
Median price asked for vacant for-sale houses and condos
$172,751
$369,853
Estimated median house or condo value
$160,100
$605,500
Median number of rooms in apartments
4.3
3.9
Median number of rooms in houses and condos
5.7
6.1
Renting percentage
56.4%
35.9%
Housing density (houses/condos per square mile)
2,683.8
2,804.3
Household income disparities
46.1%
43.8%
Housing units without a mortgage
1,800 (2.8%)
19,289 (25%)
Housing units with both a second mortgage and home equity loan
3,918 (6.2%)
160 (0.2%)
Housing units with a mortgage
61,602 (97.2%)
57,986 (75%)
Housing units with a home equity loan
270 (0.4%)
5,623 (7.3%)
Housing units with a second mortgage
5,023 (7.9%)
4,499 (5.8%)
Housing units lacking complete kitchen facilities
4.5%
0.6%
Housing units lacking complete plumbing facilities
Self-employed workers in own not incorporated business
10,069
7,611
State government workers
7,334
6,285
Unpaid family workers
199
394
Industries and Occupations
Milwaukee consistently ranks highly for its manufacturing industries. Top occupations include production, transportation, and material moving occupations. By contrast, Staten Island's economy is more service-sector driven, with professions in management, business, science, arts, sales, and office positions often dominating.
The healthcare sectors in both cities are well developed. Milwaukee has several high-ranking hospitals, and the healthcare sector is one of the biggest employers. Staten Island also has quality healthcare available, with two main hospitals and numerous specialty clinics.
Milwaukee is well structured with robust infrastructure, including well-maintained roads, an international airport, and bridges. Staten Island is directly connected to Manhattan by Ferry and is served by various highways and bridges that connect it to other parts of NYC. Ongoing projects are continuously aimed at improving existing and future infrastructures.
Infrastructure
Type
Milwaukee
Staten Island
Hospitals
29
25
TV stations
17
30
Bank branches located here
146
104
Bank institutions located here
29
19
Main business address for public companies
32
1
Drinking water stations with no reported violations in the past
24
1
Drinking water stations with reported violations in the past
21
3
Schools
School facilities
Type
Milwaukee
Staten Island
Private elementary/middle schools
78
22
Private high schools
32
13
Public elementary/middle schools
132
63
Public high schools
50
16
Colleges/Universities
25
5
Culture and Food
Culturally, both cities are rich and diverse. Milwaukee showcases Midwestern charm and is renowned for its beer and cheese, while Staten Island, generally considered the most suburban of NYC's boroughs, offers a diverse culinary experience with influences from around the world, from classic Italian to Sri Lankan cuisine.
Sports Teams
Milwaukee is home to professional sports teams including the Milwaukee Bucks (NBA) and the Brewers (MLB). On Staten Island, sports scene includes the Staten Island Yankees (minor league baseball) and two nationally competitive college teams. Moreover, Staten Island residents have quick access to the entirety of New York City's sports teams, providing a significant advantage for sports fans.


 Milwaukee, WI
 Staten Island, NY