Nashville-Davidson, TN and Lexington-Fayette, KY are contrasting urban environments, each offering unique opportunities and challenges. Nashville-Davidson is known for its robust music industry, while Lexington-Fayette is renowned for its idyllic horse farms and bourbon distilleries. The following sections will provide a comprehensive comparison of these two cities, touching on aspects like safety, weather conditions, cost of living, educational facilities, employment opportunities, infrastructure, and more.
Distance between
Nashville-Davidson, TN and
Lexington-Fayette, KY : 180.0 miles
Nashville-Davidson's population is larger by 111%. Its population has grown by 133,327 people (24.4%) since 2000. The population of Lexington-Fayette has grown by 61,281 people (23.5%) during that time.
Relative to national averages, both Nashville-Davidson, TN and Lexington-Fayette, KY have higher crime rates, but Nashville-Davidson's rates are significantly higher than Lexington-Fayette's. The violent crime rate is particularly noteworthy in Nashville-Davidson. It's worth noting, however, that crime rates can vary widely within cities, depending on the neighborhood. Visitors and residents are always advised to remain vigilant and informed about the safety conditions of specific local areas.
Cost of Living
For those looking to relocate, costs are a crucial factor. While Lexington-Fayette, KY generally has a lower cost of living compared to Nashville-Davidson, TN, this can change depending on the factors considered. Housing in Lexington-Fayette is typically cheaper than in Nashville-Davidson, yet the cost of goods and services or healthcare may vary between the cities.
Income Tax
Tennessee does not impose a state income tax, which can be beneficial for residents of Nashville-Davidson. Kentucky does have a state income tax, which ranges based on income level and would affect residents of Lexington-Fayette.
Property Tax
The property tax rates differ between the two states, with Nashville-Davidson residents paying more overall than those in Lexington-Fayette. This, combined with higher property values, can make living in Nashville-Davidson more expensive in terms of property-related expenses.
Sales Tax
Tennessee, home of Nashville-Davidson, has a higher state sales tax than Kentucky, where Lexington-Fayette is located. It's important to note, however, that Nashville-Davidson does not have a local sales tax.
Income
Type
Nashville-Davidson
Lexington-Fayette
Estimated median household income
$64,857
$60,942
Estimated per capita income
$42,268
$37,011
Cost of living index (U.S. average is 100)
90.9
89.3
If you make $50,000 in Lexington-Fayette, you will have to make $50,896 in Nashville-Davidson to maintain the same standard of living.
Geographical Conditions
Nashville-Davidson is situated in the basin of the Cumberland River, with surrounding rolling hills. Lexington-Fayette belongs to the Bluegrass region known for its fertile soil and picturesque horse farms. Both provide plenty of nature-related recreational opportunities.
Both cities boast strong educational infrastructures. Nashville-Davidson, TN is home to premium higher education institutions like Vanderbilt University, whereas the University of Kentucky highlights Lexington-Fayette's academic scene. Both cities also have numerous public and private primary and secondary schools; however, the overall quality can vary by district.
Nashville-Davidson's economy is supported by a number of industries like music, healthcare, and manufacturing, while Lexington-Fayette prominently features education, healthcare, and the horse industry as its economic backbone. Both cities offer diverse job markets, but the prevailing industries can impact the types of positions and employment opportunities available.
Biggest Employers
The largest employers in Nashville-Davidson are the Vanderbilt University Medical Center and Nissan North America, reflecting the prominence of the healthcare and manufacturing sectors. The University of Kentucky and Lexington Clinic are the biggest employers in Lexington-Fayette, evidencing the vital role of education and healthcare in the local economy.
There were 3,932 building permits issued in Nashville-Davidson in 2012 (2854 more than in 2011) compared to 792 building permits issued in Lexington-Fayette in 2012 (279 more than in 2011).
In Nashville-Davidson (Davidson County), 58.5% voted for Democrats and 39.9% for Republicans in 2012 Presidential Election. In Lexington-Fayette (Fayette County), 49.3% voted for Democrats and 48.3% for Republicans.
Elections
Type
Democrats
Republicans
Other
Year
Nashville-Davidson
Lexington-Fayette
Nashville-Davidson
Lexington-Fayette
Nashville-Davidson
Lexington-Fayette
2020
65.0%
59.4%
32.6%
38.6%
2.3%
1.9%
2016
60.1%
51.3%
34.1%
41.8%
5.7%
6.9%
2012
58.5%
49.3%
39.9%
48.3%
1.6%
2.3%
2008
60.0%
51.7%
39.0%
46.9%
1.0%
1.3%
2004
54.9%
46.3%
44.6%
53.1%
0.4%
0.6%
2000
57.9%
45.0%
40.4%
51.8%
1.7%
3.2%
1996
79.3%
47.1%
18.1%
46.3%
2.6%
6.6%
Breakdown of population affiliated with a religious congregation
Type
Adherents
Congregations
Religion
Nashville-Davidson
Lexington-Fayette
Nashville-Davidson
Lexington-Fayette
SOUTHERN BAPTIST CONVENTION
14.1%
13.7%
19.6%
19.5%
CATHOLIC CHURCH
4.9%
8.8%
2.3%
3.0%
EPISCOPAL CHURCH
1.5%
0.9%
1.8%
2.3%
SEVENTH DAY ADVENTIST CHURCH
1.1%
0.3%
1.7%
1.5%
COPTIC ORTHODOX CHURCH
1.0%
0.0%
0.5%
0.4%
MUSLIM ESTIMATE
0.8%
0.2%
1.4%
0.8%
PRESBYTERIAN CHURCH IN AMERICA
0.8%
0.3%
0.9%
0.8%
CUMBERLAND PRESBYTERIAN CHURCH
0.4%
0.0%
1.3%
0.4%
EVANGELICAL LUTHERAN CHURCH IN AMERICA
0.2%
0.4%
0.8%
1.1%
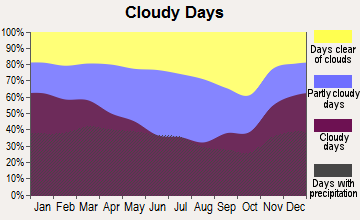
Weather
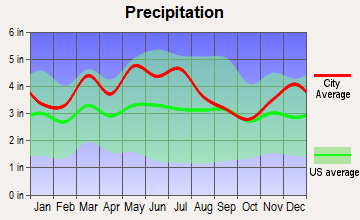
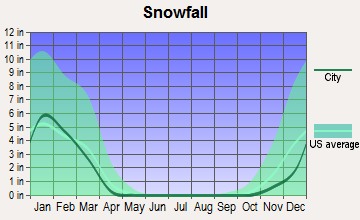
Weather wise, Nashville-Davidson, TN and Lexington-Fayette, KY experience similar, four-season climates, with cold winters and hot summers. However, Nashville-Davidson tends to have milder winters and is less likely to see snowfall. It does experience more annual rainfall than Lexington-Fayette, which can impact scheduling for outdoor activities and events.
Weather and climate
Type
Nashville-Davidson
Lexington-Fayette
Temperature - Average
58.5°F
55.3°F
Humidity - Average morning or afternoon humidity
75.9%
75.8%
Humidity - Differences between morning and afternoon humidity
38%
31%
Humidity - Maximum monthly morning or afternoon humidity
89%
85%
Humidity - Minimum monthly morning or afternoon humidity
51%
54%
Precipitation - Yearly average
49 in
45.9 in
Snowfall - Yearly average
17.8 in
35.2 in
Clouds - Number of days clear of clouds
17.1%
14.9%
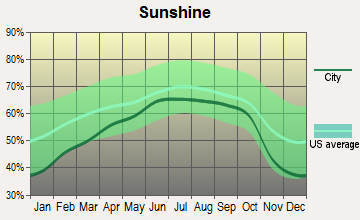
Sunshine amount - Average
59.7%
59.9%
Sunshine amount - Differences during a year
23%
25.5%
Sunshine amount - Maximum monthly
65%
66.2%
Sunshine amount - Minimum monthly
42%
40.7%
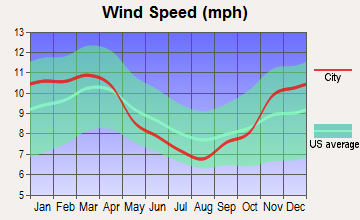
Wind speed - Average
7.7 mph
8.6 mph
Average climate in Nashville-Davidson, Tennessee
Average climate in Lexington-Fayette, Kentucky
Air pollution
Type
AQI
CO
NO2
OZONE
PB
PM10
PM25
SO2
Year
Nashville-Davidson
Lexington-Fayette
Nashville-Davidson
Lexington-Fayette
Nashville-Davidson
Lexington-Fayette
Nashville-Davidson
Lexington-Fayette
Nashville-Davidson
Nashville-Davidson
Nashville-Davidson
Lexington-Fayette
Nashville-Davidson
Lexington-Fayette
2018
71
63
0.40
N/A
13.8
3.1
24.1
31.6
N/A
N/A
15.2
N/A
9.2
9.7
0.2
0.1
2017
70
64
0.38
N/A
14.4
4.9
26.8
32.1
N/A
N/A
15.3
N/A
8.7
7.2
0.1
0.1
2016
90
68
0.42
N/A
16.1
6.6
26.4
33.3
N/A
N/A
N/A
N/A
10.1
6.9
0.0
0.1
2015
68
71
0.43
N/A
15.5
6.7
23.6
31.4
N/A
N/A
N/A
N/A
10.8
7.3
0.1
0.1
2014
66
68
N/A
N/A
N/A
6.8
26.3
34.1
N/A
N/A
N/A
N/A
9.8
7.6
1.4
0.3
2013
62
69
N/A
N/A
N/A
7.3
N/A
31.7
N/A
N/A
N/A
N/A
9.7
10.0
N/A
0.2
2012
81
81
N/A
N/A
N/A
8.1
28.3
34.9
N/A
N/A
N/A
N/A
11.0
10.6
2.3
0.8
2011
81
78
N/A
N/A
N/A
8.3
25.9
34.6
N/A
N/A
N/A
N/A
11.0
11.3
1.7
2.1
2010
80
76
N/A
N/A
N/A
9.5
24.3
34.9
N/A
N/A
N/A
N/A
12.2
10.0
2.2
2.2
2009
72
75
N/A
N/A
N/A
8.5
22.5
31.1
N/A
N/A
N/A
N/A
11.5
9.2
2.4
2.7
2008
81
72
N/A
N/A
N/A
7.8
25.7
36.4
N/A
N/A
N/A
N/A
13.4
9.1
2.5
2.4
2007
99
92
N/A
N/A
N/A
10.9
27.4
37.9
N/A
N/A
N/A
N/A
15.5
12.9
2.7
4.0
2006
93
65
0.69
N/A
N/A
11.8
24.9
32.8
N/A
N/A
N/A
N/A
14.9
N/A
2.9
3.8
2005
104
77
0.56
N/A
N/A
12.1
23.5
34.0
N/A
N/A
N/A
N/A
16.9
N/A
3.1
4.4
2004
83
60
0.61
N/A
N/A
11.6
22.0
28.6
0.006
N/A
N/A
N/A
N/A
N/A
2.6
3.2
2003
93
67
0.67
N/A
N/A
12.2
18.5
30.3
0.005
N/A
N/A
N/A
15.8
N/A
3.8
3.5
2002
92
76
0.67
0.04
N/A
12.1
20.2
31.3
N/A
N/A
N/A
N/A
15.3
N/A
4.3
3.6
2001
95
69
0.89
0.07
N/A
13.2
19.5
30.9
N/A
N/A
N/A
N/A
15.6
N/A
4.5
4.4
2000
97
79
0.74
0.14
N/A
13.4
19.8
32.7
N/A
N/A
N/A
N/A
N/A
N/A
4.1
5.0
Natural disasters
Type
Nashville-Davidson
Lexington-Fayette
Tornado activity compared to U.S. average
169.1%
126.8%
Earthquake activity compared to U.S. average
296.1%
171.6%
Natural disasters compared to U.S. average
17%
14%
Transportation
Both cities have public transportation, though Nashville-Davidson's system is more extensive than that of Lexington-Fayette. Nashville-Davidson also benefits from a high walkability score, especially in downtown areas. For Lexington-Fayette, commuting is more dependent on personal vehicles, though biking is a growing transportation mode.
Transport
Type
Nashville-Davidson
Lexington-Fayette
Amtrak stations nearby
1
0
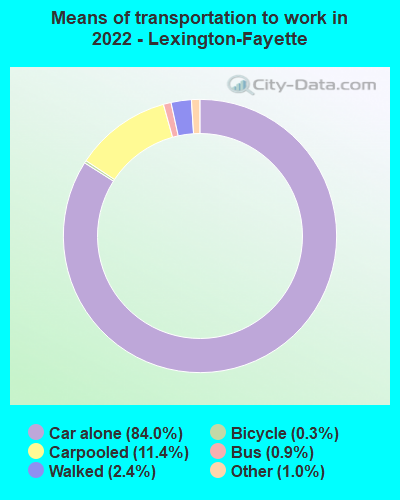
Means of transportation to work
Type
Nashville-Davidson
Lexington-Fayette
Bicycle
0.3%
0.6%
Bus
1.2%
1.2%
Carpooled
9.8%
8.3%
Car alone
85.5%
86.5%
Taxicab
0.1%
0.1%
Walked
1.8%
2.6%
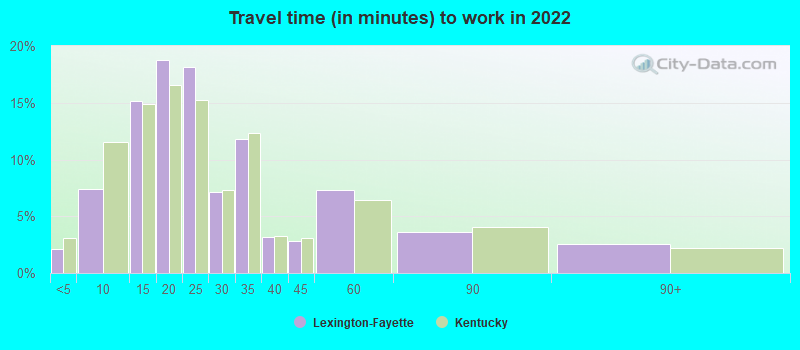
Average travel time to work
Type
Nashville-Davidson
Lexington-Fayette
Average
31.3 min
26.5 min
Other means
23.4 min
20.2 min
Public transportation
38.9 min
35 min
Private vehicle occupancy
Type
Nashville-Davidson
Lexington-Fayette
Average
1.2
1.1
Drove alone
88.7%
90.6%
In 2 person carpool
8.5%
7.7%
In 3 person carpool
1.6%
1.2%
In 4 person carpool
0.7%
0.3%
In 5-6 person carpool
0.5%
0.1%
How many people usually rode to work in the car, truck or van.
Real Estate
Real estate in both cities includes a variety of options, from urban apartments to suburban homes. Nashville-Davidson, TN generally has higher real estate prices than Lexington-Fayette, KY due to a higher demand and the appeal of living in a "music city".
Neighborhoods
Both cities tout unique neighborhoods that cater to different lifestyles. Neighborhoods in Nashville-Davidson range from the bustling downtown area, known for its nightlife, to suburban communities. Lexington-Fayette offers the historic district of downtown, with its bourbon distilleries and horse farms highlighting Kentucky's heritage.
Houses and residents
Type
Nashville-Davidson
Lexington-Fayette
Houses
331,262
147,590
Average household size (people)
2.3
2.3
Median year apartment built
1986
1983
Median year house/condo built
1984
1985
Length of stay in the house since moving in
12.2 years
12 years
Houses occupied
305,247 (92.1%)
139,303 (94.4%)
Houses occupied by owners
162,426 (53.2%)
75,129 (53.9%)
Houses occupied by renters
142,821 (46.8%)
64,174 (46.1%)
Median rent asked for vacant for-rent units
$1,391
$1,514
Median monthly housing costs
$1,291
$1,026
Median price asked for vacant for-sale houses and condos
$221,129
$229,178
Estimated median house or condo value
$346,700
$242,400
Median numbers of rooms
5.2
5.4
Median number of rooms in apartments
4.2
4
Median number of rooms in houses and condos
6.3
7
Median house price - detached houses
$437,686
$300,664
Median house price - in 2-unit structures
$320,904
$297,942
Median house price - in 3-to-4-unit structures
$319,119
$165,223
Median house price - in 5 or more unit structures
$305,249
$179,160
Median house price - mobile homes
$133,346
$37,529
Median house price - Townhouses or other attached units
$328,258
$232,720
Median house price - All housing units
$412,434
$289,099
Median house age
35
37
Renting percentage
44.6%
44.1%
Housing density (houses/condos per square mile)
699.9
518.7
House value disparities
31%
33%
Household income disparities
45.4%
46.3%
Median household income for houses/condes with a mortgage
$93,092
$95,171
Median household income for apartments without a mortgage
$68,871
$74,841
Housing units without a mortgage
3,189 (2.8%)
2,236 (4.2%)
Housing units with both a second mortgage and home equity loan
10,988 (9.6%)
6,457 (12.1%)
Housing units with a mortgage
110,850 (97.2%)
51,182 (95.8%)
Housing units with a home equity loan
333 (0.3%)
156 (0.3%)
Housing units with a second mortgage
13,192 (11.6%)
7,551 (14.1%)
House/condo owner moved in on average (years ago)
9
9
House/condo renter moved in on average (years ago)
1
1
Housing units lacking complete kitchen facilities
1.3%
1.3%
Housing units lacking complete plumbing facilities
0.5%
0.4%
Housing units in structures
Housing units in structures
Nashville-Davidson
Lexington-Fayette
One, detached
50.9%
58.7%
One, attached
8.4%
6.4%
Two
3.3%
3.0%
3 or 4
3.1%
4.9%
5 to 9
7.1%
7.5%
10 to 19
8.7%
8.4%
20 to 49
5.3%
4.3%
50 or more
11.9%
5.6%
Mobile homes
1.2%
1.3%
Boats, RVs, vans, etc.
0.1%
0.0%
Median real estate property taxes paid for housing units
Self-employed workers in own not incorporated business
31,952
9,814
State government workers
15,693
15,501
Unpaid family workers
463
346
Industries and Occupations
Nashville-Davidson, TN has a diversified economy featuring the music, healthcare, and tourism industries, with many residents employed in these fields. Lexington-Fayette, KY has a distinct emphasis on education, healthcare, and the horse industry, creating a unique occupational niche for its residents.
Both cities are served by robust healthcare systems. Nashville-Davidson's Vanderbilt University Medical Center is nationally ranked, while Lexington-Fayette's UK HealthCare is renowned regionally. Both cities also have various private clinics and hospitals.
Health (county statistics)
Type
Nashville-Davidson
Lexington-Fayette
General health status score of residents in this county from 1 (poor) to 5 (excellent)
Both Nashville-Davidson, TN and Lexington-Fayette, KY have been committed to improving infrastructure. Nashville-Davidson is known for the remarkable Music City Center, while Lexington-Fayette is home to the iconic Rupp Arena and the innovative Central Bank Center. Internet access and capacity are generally robust in both cities, though exact quality can depend on the specific location.
HMDA - Conventional home purchase loans - Applications denied
Year
Nashville-Davidson
Lexington-Fayette
1999
2,397
756
2000
1,451
655
2001
1,130
568
2002
1,075
463
2003
2,231
529
2004
2,731
777
2005
3,231
997
2006
3,720
751
2007
2,419
517
2008
952
325
2009
532
230
Culture and Food
Both cities are culturally rich, with Nashville-Davidson renowned for its country music scene and Lexington-Fayette known for its bourbon and horse-racing culture. The culinary scenes in both cities have deep local roots, but Nashville-Davidson has gained more national recognition for its hot chicken and barbecue.
Sports Teams
Nashville-Davidson is home to the NFL's Tennessee Titans and the NHL's Nashville Predators. In Lexington-Fayette, collegiate sports, particularly basketball, reign with the University of Kentucky Wildcats. Each city has a sports culture tailored to its residents' preferences and interests.


 Nashville-Davidson, TN and
  Lexington-Fayette, KY : 180.0 miles