North Las Vegas and Paradise are two distinct areas within Clark County, Nevada. North Las Vegas is a city, while Paradise is an unincorporated town and census-designated place within Las Vegas proper. Both offer unique living experiences catering to different tastes, be it for residents or tourists. Their comparative features in terms of crime, weather, cost of living, etc., cater to varying preferences that we will delve into in this comparison.
Distance between
North Las Vegas, NV and
Paradise, NV : 10.2 miles
North Las Vegas's population is larger by 48%. Its population has grown by 158,645 people (137.4%) since 2000. The population of Paradise has decreased by 221 people (0.1%) during that time.
In terms of crime and safety, North Las Vegas has a higher crime rate compared to the national average, both in terms of violent crimes and property crimes. Paradise presents a somewhat similar scenario, albeit with slightly lower rates. However, there are safe neighborhoods in both areas, and it's important to research and consider this aspect when planning a move or visit. Police presence is visible in both areas, aiding in creating a sense of security.
Cost of Living
As for the cost of living, it is somewhat more affordable to live in North Las Vegas compared to Paradise. The costs for housing, groceries, transportation, and utilities are generally lower, creating a more affordable living environment for residents. However, the lower cost of living in North Las Vegas should be weighed up against other quality-of-life factors, such as crime rates.
Income Tax
One of the major attractions of living in Nevada is the lack of state income tax. This applies to both North Las Vegas and Paradise. This tax benefit draws many people to relocate to these areas, providing a significant advantage in terms of disposable income.
Property Tax
Both North Las Vegas and Paradise have a slightly lower property tax rate compared to the national average. For homeowners, this is a financial benefit, making home ownership more affordable. The respective city services and facilities funded by these taxes are well maintained, contributing to the quality of life in both areas.
Sales Tax
Nevada's statewide sales tax is 4.6%, but both North Las Vegas and Paradise have a combined sales tax of 8.375%. This rate is the same throughout Clark County and accounts for various county and city sales taxes.
Income
Type
North Las Vegas
Paradise
Estimated median household income
$67,035
$50,096
Estimated per capita income
$26,498
$28,275
Cost of living index (U.S. average is 100)
98.3
99.3
If you make $50,000 in North Las Vegas, you will have to make $50,509 in Paradise to maintain the same standard of living.
Geographical Conditions
Geographically, North Las Vegas has a typical suburban feel with residential areas interspersed with commercial zones. Paradise boasts geographical diversity with a range of settings from urban hustle to peaceful residential neighborhoods. Both areas offer access to mountain ranges for outdoor activities.
Education-wise, both North Las Vegas and Paradise are served by the Clark County School District, one of the largest school districts in the U.S. There are several public and private schools, and higher educational institutions within reach. UNLV, a notable university, is located in Paradise. Overall, the quality and accessibility of education are commendable in both areas.
Both North Las Vegas and Paradise have their economies seemingly interlinked with the larger Las Vegas metropolitan area. They both heavily rely on tourism, hospitality, gaming, and entertainment sectors for jobs. North Las Vegas, additionally, has a growing industrial sector. Economic opportunities await in both areas, but the diversity of job sectors in North Las Vegas offers more resilience.
Biggest Employers
The largest employers in both areas cover the major industries with MGM Resorts International, Caesars Entertainment, and Wynn Resorts featuring prominently. In North Las Vegas, notable employers include Amazon and the City of North Las Vegas. These employers contribute significantly to the local economy and job market.
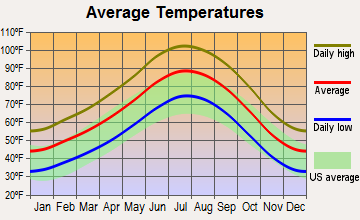
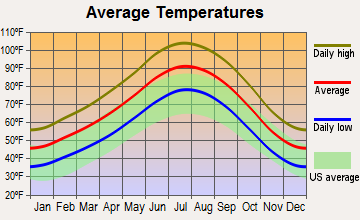
When it comes to weather, both North Las Vegas and Paradise share similar temperate desert climates. They both experience hot summers, milder winters, and low humidity levels. The temperatures can easily reach triple digits during the peak summer months. However, there's plenty of sunshine year-round, with the occasional occurrence of thunderstorms mostly during the monsoon season.
Weather and climate
Type
North Las Vegas
Paradise
Temperature - Average
65.8°F
68°F
Humidity - Average morning or afternoon humidity
30.7%
30.7%
Humidity - Differences between morning and afternoon humidity
42%
42%
Humidity - Maximum monthly morning or afternoon humidity
52%
52%
Humidity - Minimum monthly morning or afternoon humidity
10%
10%
Precipitation - Yearly average
5.4 in
4.6 in
Snowfall - Yearly average
1.6 in
1.6 in
Clouds - Number of days clear of clouds
35.1%
35.1%
Sunshine amount - Average
91.8%
91.8%
Sunshine amount - Differences during a year
16%
16%
Sunshine amount - Maximum monthly
92%
92%
Sunshine amount - Minimum monthly
76%
76%
Wind speed - Average
9.2 mph
9.2 mph
Average climate in North Las Vegas, Nevada
Average climate in Paradise, Nevada
Air pollution
Type
AQI
CO
NO2
OZONE
PM10
PM25
SO2
Year
North Las Vegas
Paradise
North Las Vegas
Paradise
North Las Vegas
Paradise
North Las Vegas
Paradise
North Las Vegas
Paradise
North Las Vegas
Paradise
North Las Vegas
Paradise
2018
100
102
0.42
0.42
14.2
15.6
35.4
34.6
27.7
29.8
7.2
7.6
0.7
0.7
2017
101
102
0.26
0.34
14.2
16.0
29.9
33.0
22.2
23.5
8.6
7.1
0.8
0.8
2016
93
107
0.37
0.39
11.9
14.1
28.4
32.2
22.8
24.0
10.2
8.1
0.8
0.8
2015
92
92
0.34
0.40
13.0
14.6
28.2
31.3
21.2
22.1
9.3
8.4
1.2
1.2
2014
91
92
0.37
0.42
11.3
12.8
27.8
29.9
23.8
25.1
10.1
9.0
1.4
1.4
2013
103
103
0.48
0.43
10.4
12.7
28.4
30.9
24.4
24.5
9.5
7.9
1.5
1.5
2012
96
96
0.52
0.47
6.0
6.6
29.5
32.8
24.8
25.6
8.8
7.4
1.4
1.4
2011
85
85
0.36
0.45
5.3
5.3
29.2
32.2
20.4
19.8
8.0
6.6
1.2
1.2
2010
81
83
0.51
0.50
5.7
5.7
28.6
31.8
18.2
17.4
7.2
6.1
N/A
N/A
2009
87
87
0.55
0.57
6.0
6.0
27.6
30.0
24.3
22.8
8.3
7.2
N/A
N/A
2008
82
83
0.66
0.61
8.2
8.2
26.3
29.3
N/A
N/A
9.5
7.5
N/A
N/A
2007
97
98
0.48
0.51
12.5
14.0
26.3
27.7
N/A
N/A
9.3
7.4
0.1
0.1
2006
102
102
0.67
0.69
14.6
16.4
26.3
29.6
N/A
N/A
9.7
8.4
0.8
0.8
2005
100
102
0.71
0.72
16.3
17.7
25.1
27.9
N/A
N/A
9.7
8.3
5.3
5.3
2004
86
88
0.63
0.71
17.4
17.6
25.5
28.8
N/A
N/A
N/A
N/A
1.6
1.6
2003
99
100
0.62
0.63
18.0
18.5
25.1
28.3
N/A
N/A
N/A
N/A
0.9
0.9
2002
94
96
0.35
0.58
17.7
18.1
24.1
28.0
N/A
N/A
N/A
N/A
0.6
0.7
2001
95
96
0.32
0.63
16.7
18.9
24.1
26.9
N/A
N/A
N/A
N/A
0.9
1.0
2000
95
96
0.34
0.73
16.2
18.1
24.0
27.0
N/A
N/A
N/A
N/A
0.4
0.4
Natural disasters
Type
North Las Vegas
Paradise
Tornado activity compared to U.S. average
2.1%
2.3%
Earthquake activity compared to U.S. average
6,003.8%
6,005.3%
Natural disasters compared to U.S. average
12%
12%
Transportation
Both Paradise and North Las Vegas offer good transportation systems, including public transit and road networks. Paradise delights with proximity to major attractions, hence shortening commuting times, especially for tourists. North Las Vegas' growing infrastructure ensures smoother commutes for its residents.
Transport
Type
North Las Vegas
Paradise
Amtrak stations nearby
1
1
FAA registered aircraft
123
0
FAA registered aircraft manufacturers and dealers
16
0
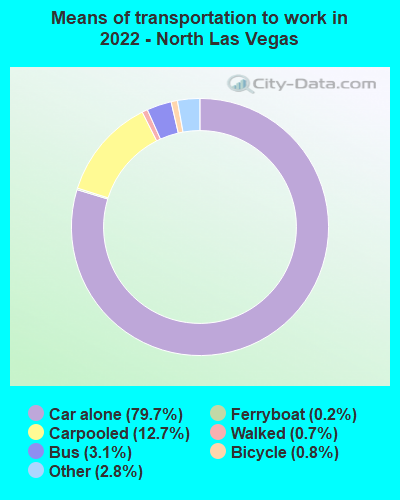
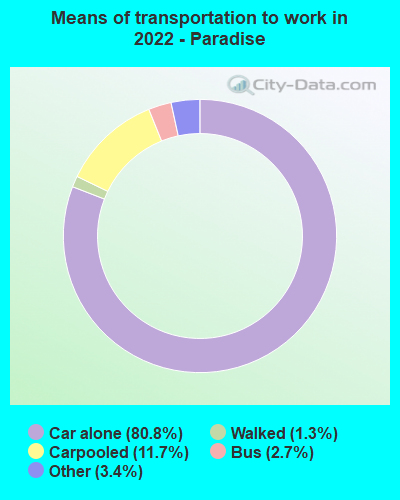
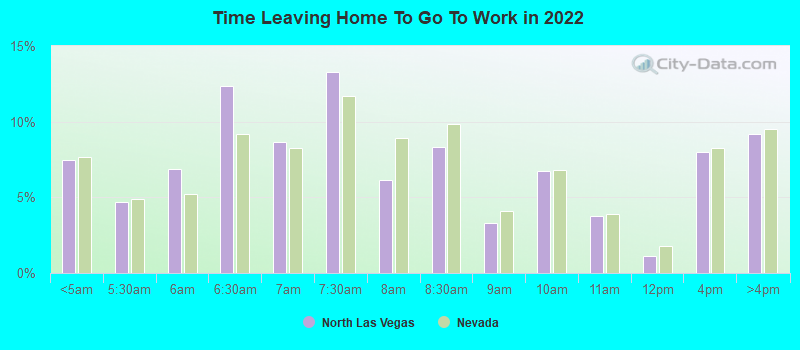
Means of transportation to work
Type
North Las Vegas
Paradise
Bicycle
0.4%
0.3%
Bus
1.6%
2.3%
Carpooled
13.4%
11.5%
Car alone
80.7%
82.3%
Motorcycle
0.4%
0.3%
Taxicab
0%
0.2%
Walked
0.7%
1.1%
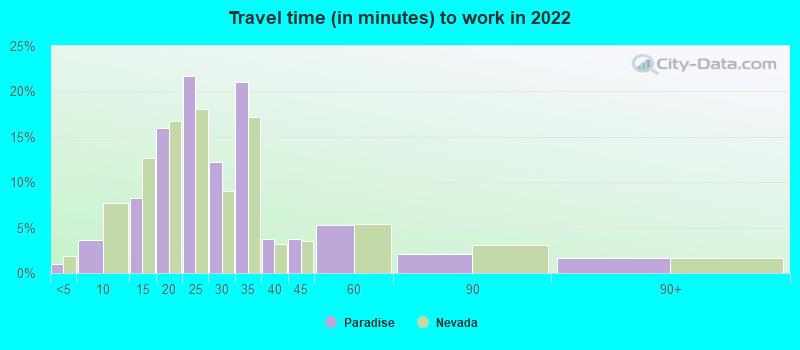
Average travel time to work
Type
North Las Vegas
Paradise
Average
25.8 min
27.5 min
Other means
25.9 min
20.4 min
Public transportation
55.9 min
43.9 min
Private vehicle occupancy
Type
North Las Vegas
Paradise
Average
1.2
1.2
Drove alone
86.9%
84.5%
In 2 person carpool
9.2%
13.8%
In 3 person carpool
2.9%
0.8%
In 4 person carpool
0.7%
0.4%
In 5-6 person carpool
0.1%
0.4%
In 7+ person carpool
0.1%
0.1%
How many people usually rode to work in the car, truck or van.
Real Estate
Real estate in North Las Vegas is generally more affordable compared to Paradise. Although prices have been increasing in recent years due to Nevada's growing popularity, it's still possible to find comfortable homes at reasonable prices in North Las Vegas. Paradise is closer to premium locations like the Vegas Strip, driving its real estate prices higher.
Neighborhoods
North Las Vegas has a variety of neighborhoods that cater to families, young professionals, and singles. These include Aliante and Eldorado. Paradise neighborhoods like Paradise Palms and Winchester also provide diverse options and are located close to the Strip, offering a more vibrant lifestyle, especially for tourists.
Houses and residents
Type
North Las Vegas
Paradise
Houses
91,034
95,898
Average household size (people)
3.2
2.5
Median year apartment built
2002
1984
Median year house/condo built
2003
1985
Length of stay in the house since moving in
9.6 years
11.6 years
Houses occupied
85,966 (94.4%)
78,005 (81.3%)
Houses occupied by owners
51,443 (59.8%)
33,900 (43.5%)
Houses occupied by renters
34,523 (40.2%)
44,105 (56.5%)
Median rent asked for vacant for-rent units
$1,592
$4,622
Median monthly housing costs
$1,378
$1,126
Median price asked for vacant for-sale houses and condos
$288,164
$238,007
Estimated median house or condo value
$335,200
$334,500
Median numbers of rooms
5.6
4.2
Median number of rooms in apartments
4.6
3.6
Median number of rooms in houses and condos
6.3
6.1
Median house price - detached houses
$347,582
$376,914
Median house price - in 3-to-4-unit structures
$321,737
$160,124
Median house price - in 5 or more unit structures
$193,128
$488,432
Median house price - mobile homes
$352,751
$56,551
Median house price - Townhouses or other attached units
$462,203
$247,245
Median house price - All housing units
$349,615
$351,599
Median house age
18
34
Renting percentage
37.6%
56.8%
Housing density (houses/condos per square mile)
1,159.5
2,034.4
House value disparities
19.6%
28.9%
Household income disparities
40.2%
46.6%
Median household income for houses/condes with a mortgage
$87,018
$80,528
Median household income for apartments without a mortgage
$67,367
$61,867
Housing units without a mortgage
317 (0.8%)
463 (2%)
Housing units with both a second mortgage and home equity loan
1,013 (2.6%)
800 (3.4%)
Housing units with a mortgage
39,101 (99.2%)
23,132 (98%)
Housing units with a home equity loan
0 (0%)
0 (0%)
Housing units with a second mortgage
1,247 (3.2%)
1,130 (4.8%)
House/condo owner moved in on average (years ago)
6
9
House/condo renter moved in on average (years ago)
1
1
Housing units lacking complete kitchen facilities
0.9%
4.5%
Housing units lacking complete plumbing facilities
1.4%
0.7%
Housing units in structures
Housing units in structures
North Las Vegas
Paradise
One, detached
75.9%
35.3%
One, attached
3.1%
5.9%
Two
1.1%
0.9%
3 or 4
4.8%
9.6%
5 to 9
4.7%
7.8%
10 to 19
3.0%
10.3%
20 to 49
2.3%
7.2%
50 or more
3.6%
21.6%
Mobile homes
1.4%
1.4%
Median real estate property taxes paid for housing units
Self-employed workers in own not incorporated business
4,201
3,926
State government workers
2,853
2,160
Unpaid family workers
530
187
Industries and Occupations
Key industries in both North Las Vegas and Paradise include tourism, gaming, hospitality, entertainment, and retail. In addition, North Las Vegas also has a burgeoning industrial sector, with several large warehouses and distribution centers. Occupations in both areas vary widely, catering to a diverse workforce.
Building and grounds cleaning and maintenance occupations
5.8%
9.3%
Material moving occupations
5.6%
3.2%
Personal care and service occupations
4.1%
5.2%
Health diagnosing and treating practitioners and other technical occupations
3.3%
3.5%
Production occupations
2.3%
2.1%
Firefighting and prevention, and other protective service workers including supervisors
2.0%
0.9%
Transportation occupations
1.9%
0.5%
Law enforcement workers including supervisors
1.7%
0.5%
Health technologists and technicians
1.5%
3.2%
Arts, design, entertainment, sports, and media occupations
1.4%
2.2%
Community and social service occupations
1.4%
1.0%
Life, physical, and social science occupations
0.7%
1.4%
Installation, maintenance, and repair occupations
0.5%
1.0%
Health Care
In the realm of healthcare, both North Las Vegas and Paradise are well served. Access to hospitals, clinics, and specialists is available in both areas, offering high-quality care. Nevada's investment in healthcare infrastructure ensures residents and visitors avail excellent medical services.
When it comes to infrastructure, Paradise enjoys a more prominent edge due to its proximity to downtown Las Vegas. Businesses, restaurants, supermarkets, and notable landmarks like the Las Vegas Strip are easily accessible. North Las Vegas, on the other hand, is developing rapidly with ongoing commercial and residential projects, offering an appealing advantage for those who prefer a less bustling environment.
HMDA - Conventional home purchase loans - Applications denied
Year
North Las Vegas
Paradise
1999
426
974
2000
190
81
2001
110
104
2002
152
78
2003
1,025
1,227
2004
2,286
1,912
2005
3,742
3,008
2006
3,581
3,071
2007
1,737
1,731
2008
574
786
2009
330
285
Culture and Food
Culturally and gastronomically, North Las Vegas and Paradise are rich. Paradise, with the Strip, offers diverse global cuisines, world-class entertainment, and cultural events. North Las Vegas also boasts of a myriad of eateries, cultural festivals, and arts events, with a slightly more laid-back appeal.
Sports Teams
In terms of sports, Paradise is home to the UNLV Rebels. North Las Vegas doesn't have its own team but residents have easy access to Las Vegas teams like the Raiders (NFL), Vegas Golden Knights (NHL), and the Aces (WNBA).


 North Las Vegas, NV
 Paradise, NV