Oklahoma City and Corpus Christi are two prominent cities differing in a number of ways including climate, cost of living, local economy, and the overall lifestyle they offer to both residents and tourists. Comparing various factors like crime rates, education, cultural experiences, tax systems, and sporting events could greatly guide those considering relocation or just a visit. This comparison will delve into the specifics of each city, providing valuable insights into what to expect in these destinations.
Distance between
Oklahoma City, OK and
Corpus Christi, TX : 534.8 miles
Oklahoma City's population is larger by 116%. Its population has grown by 181,593 people (35.9%) since 2000. The population of Corpus Christi has grown by 40,319 people (14.5%) during that time.
Statistics suggest a slightly higher crime rate in Oklahoma City as compared to Corpus Christi. This could be attributed to the larger population and urbanization of Oklahoma City. However, most areas in both cities are safe and tourist-friendly. Always, local law enforcement, community efforts, and neighborhood watches are regularly working to maintain safety in both cities.
City-data.com crime index counts serious crimes and violent crime more heavily. It adjusts for the number of visitors and daily workers commuting into cities. (higher means more crime, U.S. average = 301.1)
City-data.com crime index counts serious crimes and violent crime more heavily. It adjusts for the number of visitors and daily workers commuting into cities. (higher means more crime, U.S. average = 301.1)
Sex Offenders
According to our data, there are 1,386 registered sex offenders living in Oklahoma City and 1,068 registered sex offenders living in . The ratio of residents to sex offenders in Oklahoma City is 461 to 1; the ratio in Corpus Christi is 305 to 1. The number of registered sex offenders compared to the number of residents is a smaller in Oklahoma City than in Corpus Christi.
Cost of Living
Cost of living in Oklahoma City is below the U.S. average, making it an attractive place for relocation. However, Corpus Christi also ranks marginally below the average U.S. cost of living. Nonetheless, day-to-day expenses such as groceries, housing, and transport can be slightly cheaper in Oklahoma City compared to Corpus Christi.
Income Tax
Unlike Texas, which has no state income tax, Oklahoma does levy a state income tax, affecting residents of Oklahoma City. This could be a deciding factor for those considering relocation from a financial point of view.
Property Tax
Corpus Christi, TX, has relatively higher property taxes compared to Oklahoma City, OK. This may affect home buyer decisions, especially those considering investment in properties.
Sales Tax
Oklahoma City has a combined city and state sales tax rate of approximately 8.63%, which is a bit high compared to Corpus Christi's rate of 8.25%. These rates contribute to each city's cost of living and can impact budgeting decisions for residents and visitors.
Income
Type
Oklahoma City
Corpus Christi
Estimated median household income
$59,214
$59,812
Estimated per capita income
$31,630
$29,969
Cost of living index (U.S. average is 100)
85.4
86.6
If you make $50,000 in Oklahoma City, you will have to make $50,703 in Corpus Christi to maintain the same standard of living.
Geographical Conditions
Oklahoma City sits in the Great Plains region, presenting a more urbanized and landlocked setting. Corpus Christi is located on the Gulf of Mexico, offering beautiful beaches and a more relaxed, laid-back coastal lifestyle perfect for lovers of sun, sand, and sea.
From an education standpoint, both cities have a number of noteworthy public and private schools. However, Oklahoma City edges out with more universities and colleges giving it an advantage for those seeking higher education opportunities.
Oklahoma City has a robust economy with steady job growth, major sectors include aviation, biotech, energy, and healthcare. Corpus Christi's economy relies heavily on the oil industry, but also has a significant presence in the healthcare, education, and retail sectors. Job seekers would find opportunities in varying fields in both cities.
Biggest Employers
Oklahoma City's biggest employers are the State of Oklahoma, Oklahoma City Public Schools, and the University of Oklahoma Health Sciences Center. In Corpus Christi, Christus Spohn Health System, Corpus Christi Independent School District, and H.E.B. supermarket are major employers.
There were 4,127 building permits issued in Oklahoma City in 2012 (2834 more than in 2011) compared to 1,470 building permits issued in Corpus Christi in 2012 (839 more than in 2011).
In Oklahoma City (Oklahoma County), 41.7% voted for Democrats and 58.3% for Republicans in 2012 Presidential Election. In Corpus Christi (Nueces County), 47.6% voted for Democrats and 51.0% for Republicans.
Elections
Type
Democrats
Republicans
Other
Year
Oklahoma City
Corpus Christi
Oklahoma City
Corpus Christi
Oklahoma City
Corpus Christi
2020
48.1%
47.9%
49.2%
50.8%
2.7%
1.4%
2016
41.2%
47.2%
51.7%
48.8%
7.1%
4.0%
2012
41.7%
47.6%
58.3%
51.0%
0.0%
1.4%
2008
41.6%
47.4%
58.4%
51.8%
0.0%
0.8%
2004
35.8%
42.6%
64.2%
56.9%
0.0%
0.4%
2000
36.6%
46.7%
62.3%
51.4%
1.1%
1.9%
1996
36.5%
53.7%
54.7%
40.2%
8.8%
6.1%
Breakdown of population affiliated with a religious congregation
Type
Adherents
Congregations
Religion
Oklahoma City
Corpus Christi
Oklahoma City
Corpus Christi
SOUTHERN BAPTIST CONVENTION
20.7%
10.6%
20.0%
28.6%
CATHOLIC CHURCH
8.5%
32.8%
3.0%
10.8%
EPISCOPAL CHURCH
0.7%
0.8%
1.3%
2.0%
INTERNA PENTECO HOLINESS CHURCH
0.7%
0.2%
2.9%
0.9%
LUTHERAN CHURCH
0.5%
0.5%
1.0%
1.7%
SEVENTH DAY ADVENTIST CHURCH
0.4%
0.2%
1.5%
0.9%
AMERICAN BAPTIST CHURCHES IN THE USA
0.3%
0.0%
0.1%
0.0%
MUSLIM ESTIMATE
0.3%
0.7%
0.6%
0.3%
SALVATION ARMY
0.0%
0.5%
0.1%
0.3%
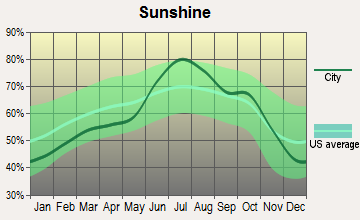
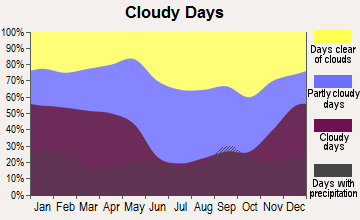
Weather
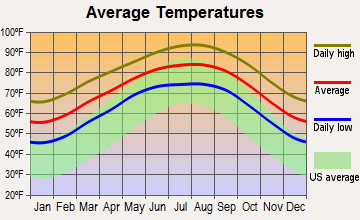
Weather contrasts are significant. Oklahoma City experiences a temperate climate with four distinct seasons, whereas Corpus Christi is subject to a hot semi-arid climate most of the year. Those who prefer a variety in weather might enjoy Oklahoma City more, but for those who love warmer climates, Corpus Christi could be a better fit.
Weather and climate
Type
Oklahoma City
Corpus Christi
Temperature - Average
60.1°F
71.5°F
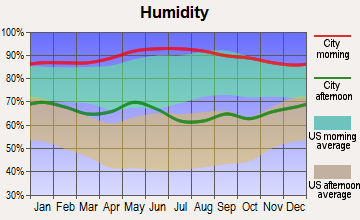
Humidity - Average morning or afternoon humidity
73.1%
81.5%
Humidity - Differences between morning and afternoon humidity
35%
37%
Humidity - Maximum monthly morning or afternoon humidity
85%
93%
Humidity - Minimum monthly morning or afternoon humidity
50%
56%
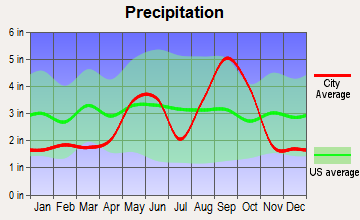
Precipitation - Yearly average
35.7 in
32.6 in
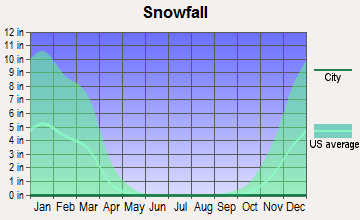
Snowfall - Yearly average
17.2 in
0.2 in
Clouds - Number of days clear of clouds
23.1%
17%
Sunshine amount - Average
72.1%
64.5%
Sunshine amount - Differences during a year
21%
36%
Sunshine amount - Maximum monthly
79%
79%
Sunshine amount - Minimum monthly
58%
43%
Wind speed - Average
12.3 mph
12.7 mph
Average climate in Oklahoma City, Oklahoma
Average climate in Corpus Christi, Texas
Air pollution
Type
AQI
CO
NO2
OZONE
PB
PM10
PM25
SO2
Year
Oklahoma City
Corpus Christi
Oklahoma City
Oklahoma City
Oklahoma City
Corpus Christi
Oklahoma City
Oklahoma City
Oklahoma City
Corpus Christi
Oklahoma City
Corpus Christi
2018
85
89
0.29
N/A
6.6
N/A
31.9
23.9
0.002
N/A
21.3
N/A
9.6
9.2
0.0
0.4
2017
82
70
0.32
N/A
6.7
N/A
33.0
27.3
0.002
N/A
20.7
N/A
8.9
8.7
0.0
0.4
2016
72
59
0.29
N/A
6.6
N/A
31.9
26.9
0.002
N/A
19.4
N/A
8.5
8.1
0.2
0.5
2015
76
75
0.24
N/A
7.0
N/A
31.5
25.9
0.002
N/A
19.1
N/A
7.8
9.3
0.5
0.3
2014
84
75
0.15
N/A
7.1
N/A
32.4
26.1
0.002
N/A
N/A
N/A
8.7
9.3
0.1
0.2
2013
84
80
0.14
N/A
8.6
N/A
32.8
27.3
0.002
N/A
N/A
N/A
9.3
8.6
0.2
0.2
2012
97
78
0.13
N/A
9.4
N/A
34.0
28.6
0.007
N/A
N/A
N/A
7.9
8.9
0.3
0.2
2011
107
80
0.24
N/A
9.9
N/A
36.3
29.3
0.003
N/A
N/A
N/A
9.9
10.0
0.8
0.3
2010
81
85
0.30
N/A
8.8
N/A
31.7
27.9
0.002
N/A
N/A
N/A
9.8
9.7
0.7
0.5
2009
82
72
0.52
N/A
8.1
N/A
31.9
26.3
0.002
N/A
N/A
N/A
10.2
9.9
0.7
0.4
2008
78
82
0.51
N/A
9.8
N/A
31.0
26.4
N/A
N/A
N/A
N/A
N/A
10.0
1.4
0.6
2007
81
85
0.44
N/A
10.2
N/A
29.4
25.3
N/A
N/A
N/A
N/A
N/A
10.3
2.0
0.5
2006
95
88
0.43
N/A
10.1
N/A
33.7
27.0
N/A
N/A
N/A
N/A
N/A
10.3
1.2
0.7
2005
88
81
0.38
N/A
11.6
N/A
31.0
24.8
N/A
N/A
N/A
N/A
N/A
10.3
1.3
1.1
2004
75
74
0.46
N/A
10.5
N/A
28.6
26.8
N/A
N/A
N/A
N/A
N/A
N/A
0.6
1.3
2003
87
88
0.42
N/A
10.9
N/A
30.8
27.0
N/A
N/A
N/A
N/A
N/A
N/A
N/A
1.0
2002
91
88
0.35
N/A
14.3
N/A
29.0
27.6
N/A
N/A
N/A
N/A
N/A
N/A
2.0
0.9
2001
87
85
0.69
N/A
13.1
N/A
31.0
26.5
N/A
N/A
N/A
N/A
N/A
N/A
1.8
1.2
2000
89
78
0.66
N/A
13.4
N/A
29.5
25.8
N/A
N/A
N/A
N/A
N/A
N/A
3.0
1.3
Natural disasters
Type
Oklahoma City
Corpus Christi
Tornado activity compared to U.S. average
353.4%
68.2%
Earthquake activity compared to U.S. average
938.9%
52%
Natural disasters compared to U.S. average
43%
24%
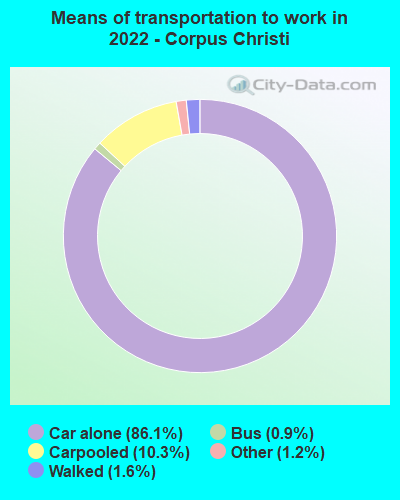
Transportation
Oklahoma City has extensive public transit systems, including buses and a modern streetcar system. Corpus Christi also has a functional bus system, but the majority of residents opt for personal vehicles as the primary mode of transportation. Corpus Christi is also proud to have a commuter-friendly road system.
Transport
Type
Oklahoma City
Corpus Christi
Amtrak stations
1
0
Amtrak stations nearby
2
0
FAA registered aircraft
0
298
FAA registered aircraft manufacturers and dealers
0
1
Means of transportation to work
Type
Oklahoma City
Corpus Christi
Bicycle
0.2%
0.2%
Bus
0.3%
1.1%
Carpooled
8.6%
9.9%
Car alone
87.6%
86.5%
Motorcycle
0.1%
0.2%
Taxicab
0.2%
0.1%
Walked
1.4%
1.4%
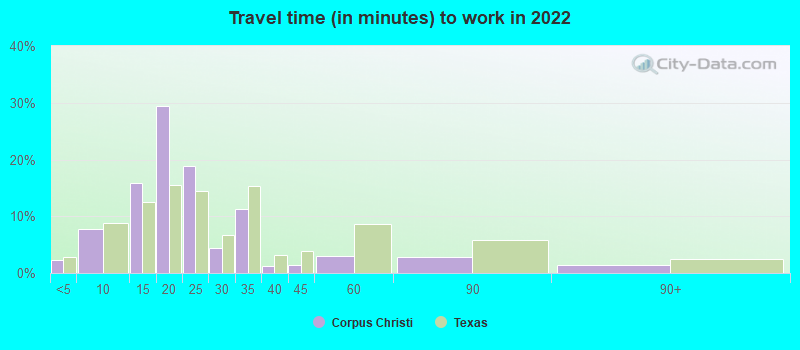
Average travel time to work
Type
Oklahoma City
Corpus Christi
Average
25.6 min
21.4 min
Other means
21 min
20.1 min
Public transportation
33.1 min
37.6 min
Private vehicle occupancy
Type
Oklahoma City
Corpus Christi
Average
1.2
1.1
Drove alone
89.5%
90.4%
In 2 person carpool
7.1%
7.6%
In 3 person carpool
1.9%
1.2%
In 4 person carpool
0.7%
0.4%
In 5-6 person carpool
0.5%
0.3%
In 7+ person carpool
0.2%
0%
How many people usually rode to work in the car, truck or van.
Real Estate
Real estate is more affordable in Oklahoma City than in Corpus Christi. This is partially due to the higher demand and limited supply in Corpus Christi. Both cities offer a mix of urban and suburban living options to suit different lifestyle preferences.
Neighborhoods
Oklahoma City is famous for its distinct neighborhoods, like Bricktown and Paseo Arts District, offering unique cultures, architecture, and community living. Corpus Christi has its charm with coastal neighborhoods such as Mustang Island and North Beach, which provide appealing sea views and beach access.
Houses and residents
Type
Oklahoma City
Corpus Christi
Houses
302,241
137,431
Average household size (people)
2.5
2.7
Median year apartment built
1978
1984
Median year house/condo built
1986
1981
Length of stay in the house since moving in
11.8 years
13.3 years
Houses occupied
275,285 (91.1%)
117,366 (85.4%)
Houses occupied by owners
164,470 (59.7%)
67,874 (57.8%)
Houses occupied by renters
110,815 (40.3%)
49,492 (42.2%)
Median rent asked for vacant for-rent units
$1,241
$1,470
Median monthly housing costs
$983
$1,102
Median price asked for vacant for-sale houses and condos
$278,299
$329,579
Estimated median house or condo value
$190,900
$171,500
Median numbers of rooms
5.5
4.9
Median number of rooms in apartments
4.3
4.1
Median number of rooms in houses and condos
6.2
5.6
Median house price - detached houses
$254,772
$212,792
Median house price - in 2-unit structures
$318,820
$219,111
Median house price - in 3-to-4-unit structures
$128,784
$270,664
Median house price - in 5 or more unit structures
$170,231
$270,817
Median house price - mobile homes
$112,256
$33,205
Median house price - occupied boats, rvs, vans etc.
$67,765
$66,701
Median house price - Townhouses or other attached units
$245,885
$168,101
Median house price - All housing units
$249,488
$210,115
Median house age
40
40
Renting percentage
40.3%
40.7%
Housing density (houses/condos per square mile)
497.9
888.7
House value disparities
34.7%
37.5%
Household income disparities
44.3%
45%
Median household income for houses/condes with a mortgage
$87,907
$84,755
Median household income for apartments without a mortgage
$61,761
$55,283
Housing units without a mortgage
1,238 (1.2%)
190 (0.5%)
Housing units with both a second mortgage and home equity loan
4,838 (4.7%)
1,163 (3.1%)
Housing units with a mortgage
100,798 (98.8%)
37,907 (99.5%)
Housing units with a home equity loan
123 (0.1%)
0 (0%)
Housing units with a second mortgage
5,921 (5.8%)
1,292 (3.4%)
House/condo owner moved in on average (years ago)
9
11
House/condo renter moved in on average (years ago)
1
1
Housing units lacking complete kitchen facilities
3.1%
2.9%
Housing units lacking complete plumbing facilities
1.9%
2.8%
Housing units in structures
Housing units in structures
Oklahoma City
Corpus Christi
One, detached
67.8%
65.0%
One, attached
3.4%
1.6%
Two
2.0%
3.0%
3 or 4
5.1%
6.5%
5 to 9
6.0%
8.7%
10 to 19
5.6%
5.7%
20 to 49
2.4%
2.3%
50 or more
4.6%
4.1%
Mobile homes
3.1%
2.8%
Boats, RVs, vans, etc.
0.1%
0.3%
Median real estate property taxes paid for housing units
Self-employed workers in own not incorporated business
20,964
10,817
State government workers
17,132
6,884
Unpaid family workers
555
230
Industries and Occupations
Oklahoma City's industry base is diversified, with a solid presence in sectors such as health, energy, and aviation, employing people across a range of occupations from technicians to scientists. Corpus Christi is primarily known for oil refining but also has a growing education and healthcare sector.
Both cities take pride in their healthcare facilities. Oklahoma City is home to the University of Oklahoma Health Sciences Center, one of the top medical facilities in the region. Corpus Christi houses excellent healthcare facilities like the Corpus Christi Medical Center and Christus Spohn hospitals.
Health (county statistics)
Type
Oklahoma City
Corpus Christi
General health status score of residents in this county from 1 (poor) to 5 (excellent)
Oklahoma City's infrastructure boasts a combination of modern skyscrapers and historic buildings, while Corpus Christi showcases a coastal city vibe coupled with impressive port facilities. OKC's ongoing projects promise more urban development. Corpus Christi, meanwhile, invests in maintaining and enhancing its waterfront infrastructure.
Infrastructure
Type
Oklahoma City
Corpus Christi
Hospitals
61
34
TV stations
20
21
Arenas or stadiums
4
1
Bank branches located here
183
83
Bank institutions located here
44
17
Main business address for public companies
15
1
Drinking water stations with no reported violations in the past
4
1
Drinking water stations with reported violations in the past
HMDA - Conventional home purchase loans - Applications denied
Year
Oklahoma City
Corpus Christi
1999
2,925
1,534
2000
2,396
814
2001
1,824
738
2002
1,507
631
2003
2,014
737
2004
2,323
1,013
2005
3,134
1,275
2006
3,132
1,217
2007
2,036
942
2008
1,143
546
2009
593
413
Culture and Food
Both cities have rich cultures to explore. Oklahoma City hosts a wide array of festivals and has a vibrant food scene, featuring Southern, Mexican, and Native American influences. Corpus Christi, being a coastal city, offers abundant seafood, superb Tex-Mex cuisine, and a lively beach culture.
Sports Teams
Sports enthusiasts would find Oklahoma City more appealing due to the presence of NBA team Oklahoma City Thunder. Corpus Christi, however, hosts several minor league teams and is home to the Texas State Aquarium and USS Lexington, attracting a different kind of sports and recreation crowd.


 Oklahoma City, OK
 Corpus Christi, TX