Oklahoma City, OK, and Irving, TX, exhibit different lifestyles for tourists and potential relocators. Each city has unique attributes, whether concerning crime and safety, climate, the economy, or culture. However, both offer inviting atmospheres and plentiful opportunities. Join us as we delve into a detailed comparison of these two cities, exploring various life aspects from taxes to sports.
Distance between
Oklahoma City, OK and
Irving, TX : 184.9 miles
Oklahoma City's population is larger by 171%. Its population has grown by 181,593 people (35.9%) since 2000. The population of Irving has grown by 62,583 people (32.7%) during that time.
In terms of personal safety and crime rates, Oklahoma City generally reports higher levels compared to Irving. However, specific neighborhoods within each city may present risky or safer areas. Tourists should stay vigilant. Irving's crime rate stands below the average for America, offering a relatively safe environment for residents and visitors.
City-data.com crime index counts serious crimes and violent crime more heavily. It adjusts for the number of visitors and daily workers commuting into cities. (higher means more crime, U.S. average = 301.1)
City-data.com crime index counts serious crimes and violent crime more heavily. It adjusts for the number of visitors and daily workers commuting into cities. (higher means more crime, U.S. average = 301.1)
Sex Offenders
According to our data, there are 1,388 registered sex offenders living in Oklahoma City and 174 registered sex offenders living in . The ratio of residents to sex offenders in Oklahoma City is 460 to 1; the ratio in Irving is 1,369 to 1. The number of registered sex offenders compared to the number of residents is much larger in Oklahoma City than that in Irving.
Cost of Living
The cost of living in Oklahoma City is generally lower than in Irving. Housing costs are significantly less in Oklahoma City, and everyday expenses like groceries and transportation also lean cheaper. However, residents in Irving often enjoy higher wages that balance out these costs.
Income Tax
Oklahoma imposes state income tax, unlike Texas; therefore, while residents in Oklahoma City pay 5% state income tax, Irving residents do not.
Property Tax
Oklahoma City boasts lower property taxes than Irving, reflecting Oklahoma's generally lower housing cost compared to Texas.
Sales Tax
Oklahoma City's combined sales tax is approximately 8.63%, higher than Irving's rate of approximately 8.25%. These rates include both state and city tax.
Income
Type
Oklahoma City
Irving
Estimated median household income
$59,214
$70,340
Estimated per capita income
$31,630
$36,210
Cost of living index (U.S. average is 100)
85.4
95.5
If you make $50,000 in Oklahoma City, you will have to make $55,913 in Irving to maintain the same standard of living.
Geographical Conditions
Oklahoma City lies within Tornado Alley on expansive plains, while Irving, part of the Dallas-Fort Worth metroplex, also presents a relatively flat terrain.
Oklahoma City is home to several universities, colleges, and public schools, notably Oklahoma City University and the University of Oklahoma Health Sciences Center. Despite some criticism of the state's public education funding, there are high-quality institutions available. Irving is part of the Dallas County Community College District, and it provides a robust public school system.
Both cities boast strong economies. Oklahoma City's economy is diverse, spanning government, energy, services, health care, technology, and administrative sectors. Irving, as part of the Dallas-Fort Worth metroplex, offers a range of employment industries, including finance, health care, retail, and tourism.
Biggest Employers
Oklahoma City hosts numerous large employers, including Hobby Lobby, Paycom, and the State of Oklahoma. Irving is home to several Fortune 500 companies, such as ExxonMobil, Fluor Corporation, and Kimberly-Clark.
There were 4,127 building permits issued in Oklahoma City in 2012 (2834 more than in 2011) compared to 366 building permits issued in Irving in 2012 (26 more than in 2011).
In Oklahoma City (Oklahoma County), 41.7% voted for Democrats and 58.3% for Republicans in 2012 Presidential Election. In Irving (Dallas County), 57.3% voted for Democrats and 41.8% for Republicans.
Elections
Type
Democrats
Republicans
Other
Year
Oklahoma City
Irving
Oklahoma City
Irving
Oklahoma City
Irving
2020
48.1%
65.1%
49.2%
33.4%
2.7%
1.4%
2016
41.2%
60.8%
51.7%
34.7%
7.1%
4.5%
2012
41.7%
57.3%
58.3%
41.8%
0.0%
1.0%
2008
41.6%
57.4%
58.4%
42.0%
0.0%
0.6%
2004
35.8%
49.0%
64.2%
50.4%
0.0%
0.5%
2000
36.6%
45.0%
62.3%
52.7%
1.1%
2.4%
1996
36.5%
46.0%
54.7%
46.8%
8.8%
7.2%
Breakdown of population affiliated with a religious congregation
Type
Adherents
Congregations
Religion
Oklahoma City
Irving
Oklahoma City
Irving
SOUTHERN BAPTIST CONVENTION
20.7%
11.0%
20.0%
31.1%
CATHOLIC CHURCH
8.5%
18.9%
3.0%
2.4%
EPISCOPAL CHURCH
0.7%
1.0%
1.3%
1.5%
INTERNA PENTECO HOLINESS CHURCH
0.7%
0.0%
2.9%
0.3%
LUTHERAN CHURCH
0.5%
0.3%
1.0%
0.7%
SEVENTH DAY ADVENTIST CHURCH
0.4%
0.5%
1.5%
1.7%
AMERICAN BAPTIST CHURCHES IN THE USA
0.3%
0.1%
0.1%
0.2%
MUSLIM ESTIMATE
0.3%
3.6%
0.6%
1.1%
EVANGELICAL LUTHERAN CHURCH IN AMERICA
0.2%
0.3%
0.9%
0.9%
Weather
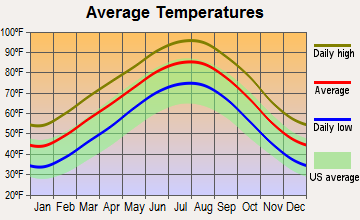
Oklahoma City experiences a range of weather conditions, including occasional tornadoes due to its location within the country's Tornado Alley. However, it also offers four distinct seasons, with cold winters and hot, humid summers. Irving typically experiences hotter summers and milder winters, offering respite for those who prefer warmer climates.
Weather and climate
Type
Oklahoma City
Irving
Temperature - Average
60.1°F
65.6°F
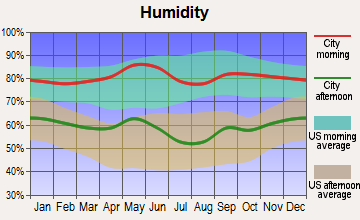
Humidity - Average morning or afternoon humidity
73.1%
71.3%
Humidity - Differences between morning and afternoon humidity
35%
34%
Humidity - Maximum monthly morning or afternoon humidity
85%
82%
Humidity - Minimum monthly morning or afternoon humidity
50%
48%
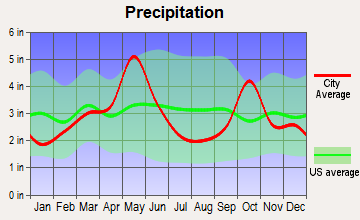
Precipitation - Yearly average
35.7 in
35.2 in
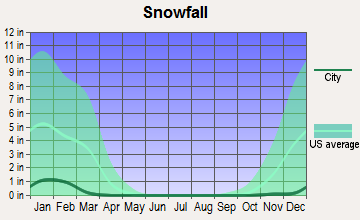
Snowfall - Yearly average
17.2 in
4.2 in
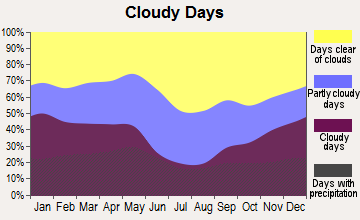
Clouds - Number of days clear of clouds
23.1%
22.8%
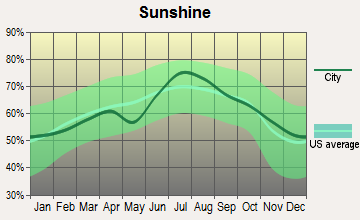
Sunshine amount - Average
72.1%
66.6%
Sunshine amount - Differences during a year
21%
20%
Sunshine amount - Maximum monthly
79%
74%
Sunshine amount - Minimum monthly
58%
54%
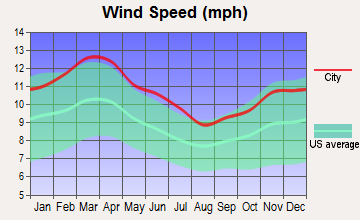
Wind speed - Average
12.3 mph
10.3 mph
Average climate in Oklahoma City, Oklahoma
Average climate in Irving, Texas
Air pollution
Type
AQI
CO
NO2
OZONE
PB
PM10
PM25
SO2
Year
Oklahoma City
Irving
Oklahoma City
Irving
Oklahoma City
Irving
Oklahoma City
Irving
Oklahoma City
Irving
Oklahoma City
Oklahoma City
Irving
Oklahoma City
Irving
2018
85
86
0.29
N/A
6.6
5.8
31.9
28.6
0.002
N/A
21.3
N/A
9.6
9.7
0.0
0.4
2017
82
84
0.32
N/A
6.7
5.7
33.0
28.9
0.002
N/A
20.7
N/A
8.9
9.1
0.0
0.3
2016
72
81
0.29
N/A
6.6
6.2
31.9
27.3
0.002
N/A
19.4
N/A
8.5
8.4
0.2
0.2
2015
76
83
0.24
N/A
7.0
6.6
31.5
26.9
0.002
N/A
19.1
N/A
7.8
8.9
0.5
0.3
2014
84
83
0.15
0.22
7.1
6.4
32.4
28.0
0.002
N/A
N/A
N/A
8.7
9.9
0.1
0.3
2013
84
96
0.14
0.25
8.6
7.0
32.8
29.1
0.002
N/A
N/A
N/A
9.3
13.0
0.2
0.2
2012
97
112
0.13
0.26
9.4
8.4
34.0
31.4
0.007
N/A
N/A
N/A
7.9
12.0
0.3
0.3
2011
107
97
0.24
0.23
9.9
8.9
36.3
31.3
0.003
N/A
N/A
N/A
9.9
11.9
0.8
0.6
2010
81
76
0.30
0.23
8.8
9.2
31.7
28.5
0.002
N/A
N/A
N/A
9.8
N/A
0.7
0.7
2009
82
88
0.52
0.25
8.1
9.1
31.9
29.3
0.002
N/A
N/A
N/A
10.2
N/A
0.7
0.5
2008
78
88
0.51
0.25
9.8
9.8
31.0
29.0
N/A
0.121
N/A
N/A
N/A
N/A
1.4
0.5
2007
81
94
0.44
0.30
10.2
10.8
29.4
26.0
N/A
0.070
N/A
N/A
N/A
N/A
2.0
0.3
2006
95
105
0.43
0.34
10.1
10.7
33.7
30.8
N/A
0.106
N/A
N/A
N/A
N/A
1.2
0.7
2005
88
110
0.38
0.34
11.6
12.7
31.0
30.0
N/A
0.142
N/A
N/A
N/A
11.1
1.3
0.9
2004
75
96
0.46
0.39
10.5
11.9
28.6
26.6
N/A
0.099
N/A
N/A
N/A
N/A
0.6
0.8
2003
87
102
0.42
0.40
10.9
13.0
30.8
27.9
N/A
0.121
N/A
N/A
N/A
N/A
N/A
1.0
2002
91
100
0.35
0.37
14.3
13.6
29.0
26.0
N/A
0.080
N/A
N/A
N/A
N/A
2.0
0.4
2001
87
100
0.69
0.48
13.1
14.1
31.0
27.2
N/A
0.069
N/A
N/A
N/A
N/A
1.8
1.0
2000
89
109
0.66
0.55
13.4
14.5
29.5
28.1
N/A
0.092
N/A
N/A
N/A
N/A
3.0
1.1
Natural disasters
Type
Oklahoma City
Irving
Tornado activity compared to U.S. average
353.4%
255.8%
Earthquake activity compared to U.S. average
938.9%
574.6%
Natural disasters compared to U.S. average
43%
21%
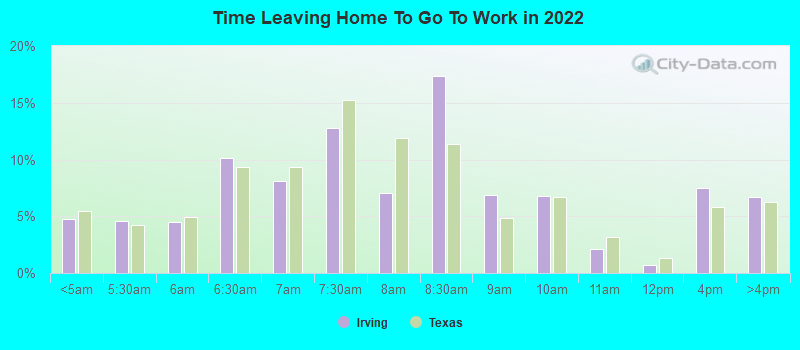
Transportation
Oklahoma City offers the EMBARK public transport system, and most residents have cars. Irving falls within the Dallas Area Rapid Transit district, rendering commuting easy without personal vehicles.
Transport
Type
Oklahoma City
Irving
Amtrak stations
1
0
Amtrak stations nearby
2
1
FAA registered aircraft
0
112
FAA registered aircraft manufacturers and dealers
0
5
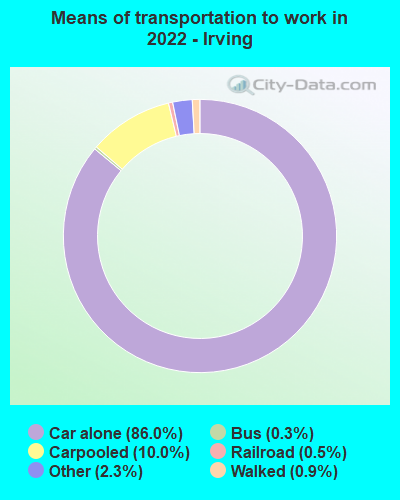
Means of transportation to work
Type
Oklahoma City
Irving
Bicycle
0.2%
0%
Bus
0.3%
0.4%
Carpooled
8.6%
9.9%
Car alone
87.6%
85.5%
Motorcycle
0.1%
0.1%
Railroad
0%
0.4%
Subway
0%
0.1%
Taxicab
0.2%
0.2%
Walked
1.4%
1.3%
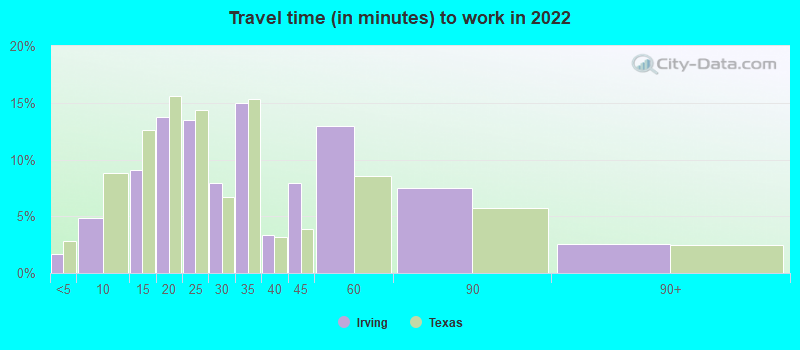
Average travel time to work
Type
Oklahoma City
Irving
Average
25.6 min
31.5 min
Other means
21 min
24.2 min
Public transportation
33.1 min
44.1 min
Private vehicle occupancy
Type
Oklahoma City
Irving
Average
1.2
1.2
Drove alone
89.5%
87.2%
In 2 person carpool
7.1%
8.8%
In 3 person carpool
1.9%
2.9%
In 4 person carpool
0.7%
0.7%
In 5-6 person carpool
0.5%
0.3%
In 7+ person carpool
0.2%
0.1%
How many people usually rode to work in the car, truck or van.
Real Estate
Oklahoma City has a relatively low cost of housing, with styles ranging from historic to modern. Irving offers diverse housing options but at higher prices, reflecting its proximity to Dallas.
Neighborhoods
Oklahoma City offers neighborhoods with a small-town feel within a metropolis, including the bohemian Paseo Arts District. Conversely, Irving's neighborhoods include the upscale Las Colinas and the historic Heritage District.
Houses and residents
Type
Oklahoma City
Irving
Houses
302,241
100,800
Average household size (people)
2.5
2.6
Median year apartment built
1978
1987
Median year house/condo built
1986
1983
Length of stay in the house since moving in
11.8 years
11.7 years
Houses occupied
275,285 (91.1%)
95,309 (94.6%)
Houses occupied by owners
164,470 (59.7%)
34,544 (36.2%)
Houses occupied by renters
110,815 (40.3%)
60,765 (63.8%)
Median rent asked for vacant for-rent units
$1,241
$1,063
Median monthly housing costs
$983
$1,330
Median price asked for vacant for-sale houses and condos
$278,299
$665,016
Estimated median house or condo value
$190,900
$274,100
Median numbers of rooms
5.5
4.2
Median number of rooms in apartments
4.3
3.5
Median number of rooms in houses and condos
6.2
6.1
Median house price - detached houses
$254,772
$337,489
Median house price - in 2-unit structures
$318,820
$126,853
Median house price - in 3-to-4-unit structures
$128,784
$134,257
Median house price - in 5 or more unit structures
$170,231
$217,218
Median house price - mobile homes
$112,256
$125,168
Median house price - Townhouses or other attached units
$245,885
$250,693
Median house price - All housing units
$249,488
$321,036
Median house age
40
35
Renting percentage
40.3%
61.6%
Housing density (houses/condos per square mile)
497.9
1,499.4
House value disparities
34.7%
33.7%
Household income disparities
44.3%
42.4%
Median household income for houses/condes with a mortgage
$87,907
$108,487
Median household income for apartments without a mortgage
$61,761
$78,490
Housing units without a mortgage
1,238 (1.2%)
261 (1.2%)
Housing units with both a second mortgage and home equity loan
4,838 (4.7%)
547 (2.6%)
Housing units with a mortgage
100,798 (98.8%)
21,104 (98.8%)
Housing units with a home equity loan
123 (0.1%)
79 (0.4%)
Housing units with a second mortgage
5,921 (5.8%)
681 (3.2%)
House/condo owner moved in on average (years ago)
9
10
House/condo renter moved in on average (years ago)
1
1
Housing units lacking complete kitchen facilities
3.1%
2.2%
Housing units lacking complete plumbing facilities
1.9%
1.5%
Housing units in structures
Housing units in structures
Oklahoma City
Irving
One, detached
67.8%
39.8%
One, attached
3.4%
3.8%
Two
2.0%
2.0%
3 or 4
5.1%
5.8%
5 to 9
6.0%
11.3%
10 to 19
5.6%
15.2%
20 to 49
2.4%
7.0%
50 or more
4.6%
13.9%
Mobile homes
3.1%
1.3%
Boats, RVs, vans, etc.
0.1%
0.0%
Median real estate property taxes paid for housing units
Self-employed workers in own not incorporated business
20,964
9,391
State government workers
17,132
2,329
Unpaid family workers
555
283
Industries and Occupations
Energy, healthcare, and information technology stand as major industries in Oklahoma City. Irving is a hub for global businesses, boasting a diverse range of industries from finance to telecommunications.
Both cities provide quality health care, with Oklahoma City hosting the OU Medicine Complex. Irving residents benefit from proximity to Dallas's superior health care facilities.
Health (county statistics)
Type
Oklahoma City
Irving
General health status score of residents in this county from 1 (poor) to 5 (excellent)
Oklahoma City has exceptional logistical infrastructure, offering excellent roadways and a public transit system. It also houses one of the world's largest livestock markets. Meanwhile, Irving is part of the Dallas Area Rapid Transit system and hosts a vast urban center, Las Colinas.
Infrastructure
Type
Oklahoma City
Irving
Hospitals
61
12
TV stations
20
26
Arenas or stadiums
4
1
Bank branches located here
183
52
Bank institutions located here
44
20
Main business address for public companies
15
26
Drinking water stations with no reported violations in the past
4
0
Drinking water stations with reported violations in the past
HMDA - Conventional home purchase loans - Applications denied
Year
Oklahoma City
Irving
1999
2,925
1,047
2000
2,396
375
2001
1,824
307
2002
1,507
239
2003
2,014
722
2004
2,323
647
2005
3,134
1,099
2006
3,132
1,041
2007
2,036
618
2008
1,143
368
2009
593
179
Culture and Food
Oklahoma City offers a combination of Western and Native American cultures, reflected in its food and festivals. Irving provides a diverse blend of cultures, influenced heavily by its Hispanic community.
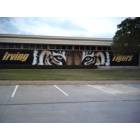
Sports Teams
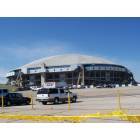
Oklahoma City is home to the NBA's Thunder. Irving, though lacking home teams, stands near Dallas, offering access to the Cowboys (NFL), the Mavericks (NBA), and the Rangers (MLB).


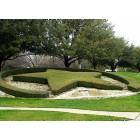

 Oklahoma City, OK
 Irving, TX