Oklahoma City, OK, and Lincoln, NE, are two American cities popular among both tourists and potential movers for their unique appeals. Oklahoma City, known for its cowboy culture, is also famous for low living costs, while Lincoln is recognized for its vibrant cultural scene and solid educational system. This comprehensive comparison between the two cities will help you better understand their differences in terms of crime rate, infrastructure, economy, education, and many more aspects.
Distance between
Oklahoma City, OK and
Lincoln, NE : 371.0 miles
Oklahoma City's population is larger by 135%. Its population has grown by 181,593 people (35.9%) since 2000. The population of Lincoln has grown by 67,076 people (29.7%) during that time.
According to the data, Oklahoma City tends to have a higher crime rate than Lincoln. OKC's crime rate is higher than approximately 81% of the cities in the state, while Lincoln's crime rate is lower than about 24% of Nebraska cities. However, it's crucial to consider that how safe you feel can often depend on the neighborhood you choose to live in or visit.
City-data.com crime index counts serious crimes and violent crime more heavily. It adjusts for the number of visitors and daily workers commuting into cities. (higher means more crime, U.S. average = 301.1)
City-data.com crime index counts serious crimes and violent crime more heavily. It adjusts for the number of visitors and daily workers commuting into cities. (higher means more crime, U.S. average = 301.1)
Sex Offenders
According to our data, there are 1,386 registered sex offenders living in Oklahoma City and 883 registered sex offenders living in . The ratio of residents to sex offenders in Oklahoma City is 461 to 1; the ratio in Lincoln is 318 to 1. The number of registered sex offenders compared to the number of residents is a smaller in Oklahoma City than in Lincoln.
Cost of Living
The cost of living tends to be lower in Oklahoma City than in Lincoln, particularly related to housing. Oklahoma City's overall cost of living index stands at less than 90, significantly lower than the U.S. average. Meanwhile, Lincoln's cost of living index is very close to the national average. Both cities offer below-average public transportation and grocery costs.
Income Tax
Nebraska's state income tax is progressive and ranges from 2.46% to 6.84%. Oklahoma has a similar progressive tax system, but the rates are slightly lower, ranging from 0.5% to 5%.
Property Tax
Property tax rates are generally higher in Nebraska compared to Oklahoma. On average, the property tax rate in Lincoln, NE, is around 2.1%, while it is only around 0.9% in Oklahoma City, OK.
Sales Tax
Oklahoma City residents deal with a higher combined city and state sales tax rate compared to Lincoln - sitting above 8%. Meanwhile, Lincoln residents encounter, on average, a minimum 7% sales tax.
Income
Type
Oklahoma City
Lincoln
Estimated median household income
$59,214
$62,294
Estimated per capita income
$31,630
$34,008
Cost of living index (U.S. average is 100)
85.4
84.5
If you make $50,000 in Lincoln, you will have to make $50,533 in Oklahoma City to maintain the same standard of living.
Geographical Conditions
Oklahoma City is located in the Great Plains region and is known for its frequent tornadoes. Lincoln is situated on the vast plains of eastern Nebraska, offering a less extreme climate and pristine landscapes, including parks and lakes.
Lincoln, home to the University of Nebraska, offers higher education opportunities and a solid K-12 education system. Oklahoma City has numerous universities, including the University of Oklahoma, and a variety of public and private schools, but according to national ratings, their educational system seems less robust compared to Lincoln.
Both cities have diverse economies, but the dominant industries vary. Oklahoma City's economy is heavily reliant on public sector jobs, including government and military, along with sectors like oil, natural gas, and healthcare. In contrast, Lincoln's economy is anchored by industries like education, healthcare, and finance.
Biggest Employers
The largest employers in Oklahoma City include the State of Oklahoma, INTEGRIS Health, and Oklahoma City Public Schools. Meanwhile, in Lincoln, the University of Nebraska-Lincoln, the state government, and Bryan Health top the list.
There were 4,127 building permits issued in Oklahoma City in 2012 (2834 more than in 2011) compared to 1,093 building permits issued in Lincoln in 2012 (549 more than in 2011).
In Oklahoma City (Oklahoma County), 41.7% voted for Democrats and 58.3% for Republicans in 2012 Presidential Election. In Lincoln (Lancaster County), 48.7% voted for Democrats and 49.0% for Republicans.
Elections
Type
Democrats
Republicans
Other
Year
Oklahoma City
Lincoln
Oklahoma City
Lincoln
Oklahoma City
Lincoln
2020
48.1%
52.3%
49.2%
44.6%
2.7%
3.1%
2016
41.2%
45.4%
51.7%
45.2%
7.1%
9.4%
2012
41.7%
48.7%
58.3%
49.0%
0.0%
2.3%
2008
41.6%
51.6%
58.4%
46.6%
0.0%
1.9%
2004
35.8%
42.6%
64.2%
56.3%
0.0%
1.1%
2000
36.6%
41.7%
62.3%
51.9%
1.1%
6.4%
1996
36.5%
44.4%
54.7%
45.9%
8.8%
9.8%
Breakdown of population affiliated with a religious congregation
Type
Adherents
Congregations
Religion
Oklahoma City
Lincoln
Oklahoma City
Lincoln
SOUTHERN BAPTIST CONVENTION
20.7%
0.7%
20.0%
3.0%
CATHOLIC CHURCH
8.5%
14.9%
3.0%
6.8%
EPISCOPAL CHURCH
0.7%
0.4%
1.3%
1.7%
INTERNA PENTECO HOLINESS CHURCH
0.7%
0.0%
2.9%
0.0%
LUTHERAN CHURCH
0.5%
4.6%
1.0%
5.9%
SEVENTH DAY ADVENTIST CHURCH
0.4%
1.4%
1.5%
3.4%
AMERICAN BAPTIST CHURCHES IN THE USA
0.3%
0.1%
0.1%
1.3%
MUSLIM ESTIMATE
0.3%
0.2%
0.6%
0.8%
EVANGELICAL LUTHERAN CHURCH IN AMERICA
0.2%
5.0%
0.9%
6.4%
REFORMED CHURCH IN AMERICA
0.1%
0.4%
0.1%
1.3%
SALVATION ARMY
0.0%
0.4%
0.1%
0.4%
Weather
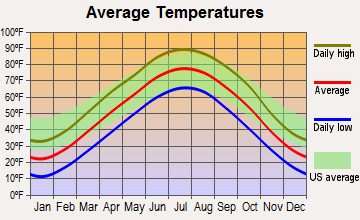
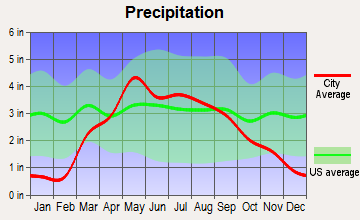
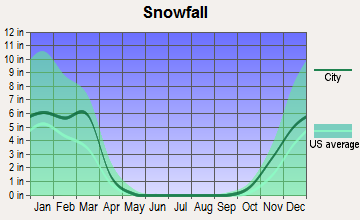
Both cities experience hot summers and cold winters, though Oklahoma City's summers can be hotter, and winters can be milder compared to Lincoln. This Midwestern climate offers a balanced amount of hot and cold weather, perfect for those who like to experience all seasons. Lincoln tends to receive more rain and snowfall, which could be an attraction for some individuals.
Weather and climate
Type
Oklahoma City
Lincoln
Temperature - Average
60.1°F
51.1°F
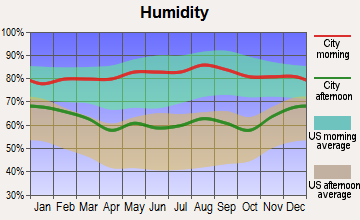
Humidity - Average morning or afternoon humidity
73.1%
75.2%
Humidity - Differences between morning and afternoon humidity
35%
35%
Humidity - Maximum monthly morning or afternoon humidity
85%
87%
Humidity - Minimum monthly morning or afternoon humidity
50%
52%
Precipitation - Yearly average
35.7 in
29.1 in
Snowfall - Yearly average
17.2 in
53 in
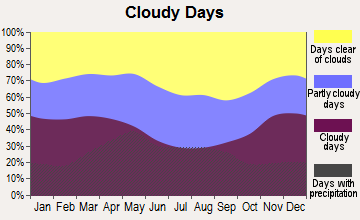
Clouds - Number of days clear of clouds
23.1%
19.6%
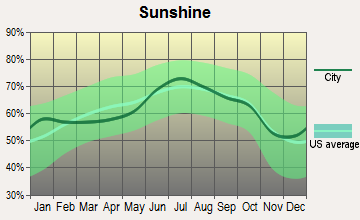
Sunshine amount - Average
72.1%
65.4%
Sunshine amount - Differences during a year
21%
23%
Sunshine amount - Maximum monthly
79%
73%
Sunshine amount - Minimum monthly
58%
50%
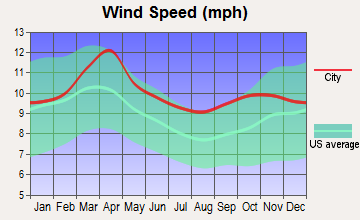
Wind speed - Average
12.3 mph
10.6 mph
Average climate in Oklahoma City, Oklahoma
Average climate in Lincoln, Nebraska
Air pollution
Type
AQI
CO
NO2
OZONE
PB
PM10
PM25
SO2
Year
Oklahoma City
Lincoln
Oklahoma City
Lincoln
Oklahoma City
Oklahoma City
Lincoln
Oklahoma City
Oklahoma City
Oklahoma City
Oklahoma City
2018
85
46
0.29
N/A
6.6
N/A
31.9
28.8
0.002
N/A
21.3
N/A
9.6
N/A
0.0
N/A
2017
82
47
0.32
N/A
6.7
N/A
33.0
27.6
0.002
N/A
20.7
N/A
8.9
N/A
0.0
N/A
2016
72
48
0.29
N/A
6.6
N/A
31.9
30.4
0.002
N/A
19.4
N/A
8.5
N/A
0.2
N/A
2015
76
54
0.24
N/A
7.0
N/A
31.5
31.3
0.002
N/A
19.1
N/A
7.8
N/A
0.5
N/A
2014
84
54
0.15
N/A
7.1
N/A
32.4
29.1
0.002
N/A
N/A
N/A
8.7
N/A
0.1
N/A
2013
84
46
0.14
N/A
8.6
N/A
32.8
29.1
0.002
N/A
N/A
N/A
9.3
N/A
0.2
N/A
2012
97
41
0.13
N/A
9.4
N/A
34.0
32.7
0.007
N/A
N/A
N/A
7.9
N/A
0.3
N/A
2011
107
30
0.24
0.32
9.9
N/A
36.3
26.3
0.003
N/A
N/A
N/A
9.9
N/A
0.8
N/A
2010
81
31
0.30
0.39
8.8
N/A
31.7
25.0
0.002
N/A
N/A
N/A
9.8
N/A
0.7
N/A
2009
82
58
0.52
0.42
8.1
N/A
31.9
23.4
0.002
N/A
N/A
N/A
10.2
N/A
0.7
N/A
2008
78
31
0.51
0.40
9.8
N/A
31.0
25.4
N/A
N/A
N/A
N/A
N/A
N/A
1.4
N/A
2007
81
35
0.44
0.47
10.2
N/A
29.4
27.8
N/A
N/A
N/A
N/A
N/A
N/A
2.0
N/A
2006
95
38
0.43
0.55
10.1
N/A
33.7
26.7
N/A
N/A
N/A
N/A
N/A
N/A
1.2
N/A
2005
88
40
0.38
0.62
11.6
N/A
31.0
28.2
N/A
N/A
N/A
N/A
N/A
N/A
1.3
N/A
2004
75
37
0.46
0.68
10.5
N/A
28.6
27.1
N/A
N/A
N/A
N/A
N/A
N/A
0.6
N/A
2003
87
43
0.42
0.63
10.9
N/A
30.8
29.2
N/A
N/A
N/A
N/A
N/A
N/A
N/A
N/A
2002
91
39
0.35
0.62
14.3
N/A
29.0
27.3
N/A
N/A
N/A
N/A
N/A
N/A
2.0
N/A
2001
87
41
0.69
0.73
13.1
N/A
31.0
26.5
N/A
N/A
N/A
N/A
N/A
N/A
1.8
N/A
2000
89
40
0.66
0.71
13.4
N/A
29.5
27.8
N/A
N/A
N/A
N/A
N/A
N/A
3.0
N/A
Natural disasters
Type
Oklahoma City
Lincoln
Tornado activity compared to U.S. average
353.4%
199.3%
Earthquake activity compared to U.S. average
938.9%
471.2%
Natural disasters compared to U.S. average
43%
12%
Transportation
Both cities provide public transportation options, including buses. Oklahoma City also has a modern streetcar system, but neither city is particularly known for its public transportation system. Traffic is generally manageable in both cities, though Oklahoma City, due to its larger size, may experience more congestion.
Transport
Type
Oklahoma City
Lincoln
Amtrak stations
1
1
Amtrak stations nearby
2
1
FAA registered aircraft
0
240
FAA registered aircraft manufacturers and dealers
0
3
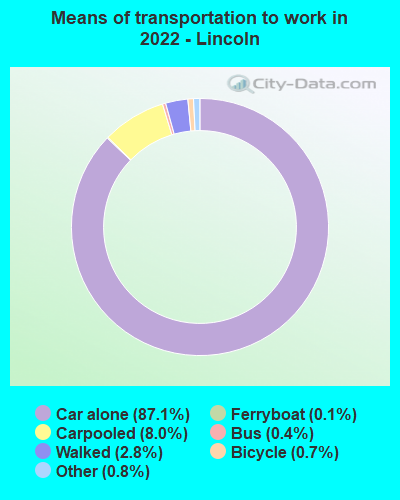
Means of transportation to work
Type
Oklahoma City
Lincoln
Bicycle
0.2%
0.8%
Bus
0.3%
1.1%
Carpooled
8.6%
10.2%
Car alone
87.6%
83.4%
Motorcycle
0.1%
0.1%
Taxicab
0.2%
0%
Walked
1.4%
3.4%
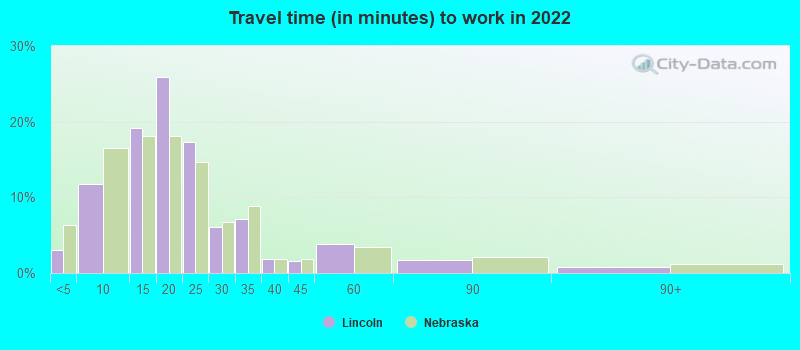
Average travel time to work
Type
Oklahoma City
Lincoln
Average
25.6 min
21.5 min
Other means
21 min
18.8 min
Public transportation
33.1 min
28.9 min
Private vehicle occupancy
Type
Oklahoma City
Lincoln
Average
1.2
1.1
Drove alone
89.5%
88.3%
In 2 person carpool
7.1%
10%
In 3 person carpool
1.9%
1.1%
In 4 person carpool
0.7%
0.3%
In 5-6 person carpool
0.5%
0.3%
In 7+ person carpool
0.2%
0%
How many people usually rode to work in the car, truck or van.
Real Estate
In terms of real estate, housing is more affordable in Oklahoma City, with a median home cost significantly below the national average. Lincoln also offers affordable housing, but prices are slightly higher compared to Oklahoma City.
Neighborhoods
Oklahoma City offers diverse neighborhoods, from the artistic district of Paseo to the family-friendly suburb of Nichols Hills. Lincoln also provides a range of communities, from the historic Haymarket District to the vibrant downtown area.
Houses and residents
Type
Oklahoma City
Lincoln
Houses
302,241
126,262
Average household size (people)
2.5
2.4
Median year apartment built
1978
1983
Median year house/condo built
1986
1979
Length of stay in the house since moving in
11.8 years
12.1 years
Houses occupied
275,285 (91.1%)
120,407 (95.4%)
Houses occupied by owners
164,470 (59.7%)
70,003 (58.1%)
Houses occupied by renters
110,815 (40.3%)
50,404 (41.9%)
Median rent asked for vacant for-rent units
$1,241
$849.83
Median monthly housing costs
$983
$1,000
Median price asked for vacant for-sale houses and condos
$278,299
$413,349
Estimated median house or condo value
$190,900
$228,000
Median numbers of rooms
5.5
5.7
Median number of rooms in apartments
4.3
3.9
Median number of rooms in houses and condos
6.2
7
Median house price - detached houses
$254,772
$244,409
Median house price - in 2-unit structures
$318,820
$146,009
Median house price - in 3-to-4-unit structures
$128,784
$318,993
Median house price - in 5 or more unit structures
$170,231
$99,016
Median house price - mobile homes
$112,256
$14,649
Median house price - Townhouses or other attached units
$245,885
$282,955
Median house price - All housing units
$249,488
$242,537
Median house age
40
40
Renting percentage
40.3%
41.4%
Housing density (houses/condos per square mile)
497.9
1,691.6
House value disparities
34.7%
29.7%
Household income disparities
44.3%
43.1%
Median household income for houses/condes with a mortgage
$87,907
$97,001
Median household income for apartments without a mortgage
$61,761
$72,157
Housing units without a mortgage
1,238 (1.2%)
1,686 (3.6%)
Housing units with both a second mortgage and home equity loan
4,838 (4.7%)
3,489 (7.5%)
Housing units with a mortgage
100,798 (98.8%)
44,764 (96.4%)
Housing units with a home equity loan
123 (0.1%)
0 (0%)
Housing units with a second mortgage
5,921 (5.8%)
4,382 (9.4%)
House/condo owner moved in on average (years ago)
9
10
House/condo renter moved in on average (years ago)
1
1
Housing units lacking complete kitchen facilities
3.1%
0.8%
Housing units lacking complete plumbing facilities
1.9%
0.3%
Housing units in structures
Housing units in structures
Oklahoma City
Lincoln
One, detached
67.8%
58.3%
One, attached
3.4%
8.0%
Two
2.0%
2.3%
3 or 4
5.1%
2.9%
5 to 9
6.0%
5.6%
10 to 19
5.6%
7.4%
20 to 49
2.4%
7.6%
50 or more
4.6%
6.4%
Mobile homes
3.1%
1.5%
Boats, RVs, vans, etc.
0.1%
0.0%
Median real estate property taxes paid for housing units
Self-employed workers in own not incorporated business
20,964
9,332
State government workers
17,132
14,738
Unpaid family workers
555
298
Industries and Occupations
In Oklahoma City, industries like oil, natural gas, and health care play significant roles, while education, government and military jobs are also prevalent. Lincoln is strong in education, healthcare, finance, and insurance sectors, with a growing tech start-up scene as well.
Both cities provide access to quality health care services with several hospitals and clinics. However, Oklahoma City, being larger, tends to offer more options.
Health (county statistics)
Type
Oklahoma City
Lincoln
General health status score of residents in this county from 1 (poor) to 5 (excellent)
Oklahoma City, being larger in size, offers more infrastructure development, including larger airports, roads, and public buildings. Lincoln, while smaller, is well-structured and continually updated. Both have consistent utility services and solid internet connectivity.
Infrastructure
Type
Oklahoma City
Lincoln
Hospitals
61
11
TV stations
20
16
Arenas or stadiums
4
3
Bank branches located here
183
123
Bank institutions located here
44
21
Main business address for public companies
15
8
Drinking water stations with no reported violations in the past
4
6
Drinking water stations with reported violations in the past
HMDA - Conventional home purchase loans - Applications denied
Year
Oklahoma City
Lincoln
1999
2,925
563
2000
2,396
394
2001
1,824
262
2002
1,507
246
2003
2,014
334
2004
2,323
357
2005
3,134
416
2006
3,132
374
2007
2,036
223
2008
1,143
149
2009
593
97
Culture and Food
Oklahoma City offers a rich cowboy culture and a burgeoning food scene. On the other hand, Lincoln boasts a vibrant arts scene, with numerous galleries, cinemas, and theaters, along with a healthy food scene with a focus on local produce and cuisines.
Sports Teams
Oklahoma City has professional sports teams like the OKC Thunder in the NBA. Lincoln, though it does not have major league professional sports, it boasts popular college sports teams, namely the Nebraska Cornhuskers.


 Oklahoma City, OK
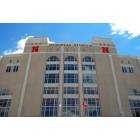
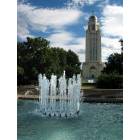
 Lincoln, NE