Philadelphia, PA, and Tampa, FL, both offer unique lifestyles shaped by their distinct geographical settings, history, and demography. While Philadelphia is an iconic city known for its gritty atmosphere and rich history, Tampa offers a laid-back lifestyle with its tropical climate and beach access. A comparison of these two cities in various aspects like crime rate, weather, cost of living, education, economy, and infrastructure, among others, can provide potential residents and tourists a comprehensive understanding of life in these cities.
Distance between
Philadelphia, PA and
Tampa, FL : 929.9 miles
Philadelphia's population is larger by 307%. Its population has grown by 58,701 people (3.9%) since 2000. The population of Tampa has grown by 83,603 people (27.6%) during that time.
Philadelphia has a higher crime rate compared to Tampa. While both cities have areas of higher crime, tourists and residents are generally safe if they take common-sense precautions, such as avoiding certain neighborhoods at night. Tampa's crime rate has been decreasing over the years, while Philadelphia has seen a recent uptick, particularly in violent crime. Tampa has a highly responsive police force, with numerous initiatives to improve safety.
City-data.com crime index counts serious crimes and violent crime more heavily. It adjusts for the number of visitors and daily workers commuting into cities. (higher means more crime, U.S. average = 301.1)
City-data.com crime index counts serious crimes and violent crime more heavily. It adjusts for the number of visitors and daily workers commuting into cities. (higher means more crime, U.S. average = 301.1)
Sex Offenders
According to our data, there are 2,776 registered sex offenders living in Philadelphia and 1,345 registered sex offenders living in . The ratio of residents to sex offenders in Philadelphia is 565 to 1; the ratio in Tampa is 280 to 1. The number of registered sex offenders compared to the number of residents is a smaller in Philadelphia than in Tampa.
Cost of Living
Tampa has a lower cost of living compared to Philadelphia. Housing, in particular, is more affordable in Tampa. The overall cost of goods and services is also lower in Tampa, contributing to a more affordable lifestyle compared to Philadelphia.
Income Tax
Pennsylvania has a state income tax of 3.07%, while Philadelphia imposes an additional 3.8712% on wages for city residents. Florida, on the other hand, has no state income tax, offering potential savings for Tampa residents.
Property Tax
On average, property taxes are higher in Philadelphia than in Tampa. Both cities, however, offer homestead exemptions, which can reduce the taxable value of a home for owner-occupants.
Sales Tax
Philadelphia has a higher sales tax at 8%, compared to Tampa's 8.5%. However, Florida does not have a state income tax, making it potentially more appealing to some prospective residents.
Income
Type
Philadelphia
Tampa
Estimated median household income
$52,899
$63,404
Estimated per capita income
$32,707
$43,517
Cost of living index (U.S. average is 100)
105.4
99.8
If you make $50,000 in Tampa, you will have to make $52,806 in Philadelphia to maintain the same standard of living.
Geographical Conditions
Philadelphia is located in the Northeast United States, featuring a mix of urban and suburban environments. Tampa is situated on the west coast of Florida, boasting beaches, rivers, and bayous, with a much more laid-back, tropical setting.
Philadelphia has a robust educational environment, with many prestigious schools and universities, like the University of Pennsylvania and Temple University. On the other hand, Tampa also offers good educational opportunities, with the University of Tampa and the University of South Florida.
Philadelphia's economy is diverse, with sectors like healthcare, education, and professional services playing major roles. Tampa has a thriving economy with a strong focus on tourism, healthcare, and retail trade. Both cities have seen steady job growth, with Tampa slightly outpacing Philadelphia.
Biggest Employers
The University of Pennsylvania and Comcast are among the biggest employers in Philadelphia. The Tampa Bay area's largest employers include BayCare Health System and Publix Super Markets.
There were 1,553 building permits issued in Philadelphia in 2012 (1108 more than in 2011) compared to 1,312 building permits issued in Tampa in 2012 (722 more than in 2011).
In Philadelphia (Philadelphia County), 85.2% voted for Democrats and 14.0% for Republicans in 2012 Presidential Election. In Tampa (Hillsborough County), 53.0% voted for Democrats and 46.3% for Republicans.
Elections
Type
Democrats
Republicans
Other
Year
Philadelphia
Tampa
Philadelphia
Tampa
Philadelphia
Tampa
2020
81.2%
52.9%
17.9%
46.0%
0.9%
1.1%
2016
82.3%
51.2%
15.3%
44.4%
2.4%
4.5%
2012
85.2%
53.0%
14.0%
46.3%
0.8%
0.6%
2008
83.2%
53.4%
16.4%
46.2%
0.4%
0.4%
2004
80.6%
46.4%
19.4%
53.2%
0.0%
0.4%
2000
80.4%
47.2%
18.1%
50.4%
1.5%
2.4%
1996
77.4%
46.8%
16.0%
44.3%
6.6%
8.9%
Breakdown of population affiliated with a religious congregation
Type
Adherents
Congregations
Religion
Philadelphia
Tampa
Philadelphia
Tampa
CATHOLIC CHURCH
24.8%
10.7%
8.8%
2.8%
AMERICAN BAPTIST CHURCHES IN THE USA
3.8%
0.0%
6.7%
0.2%
MUSLIM ESTIMATE
2.6%
1.7%
3.1%
1.1%
SOUTHERN BAPTIST CONVENTION
2.2%
8.3%
9.9%
19.4%
EPISCOPAL CHURCH
0.8%
0.5%
3.8%
1.4%
EVANGELICAL LUTHERAN CHURCH IN AMERICA
0.6%
0.5%
3.1%
1.2%
PRESBYTERIAN CHURCH IN AMERICA
0.4%
0.1%
1.4%
0.7%
SEVENTH DAY ADVENTIST CHURCH
0.4%
0.5%
1.7%
2.2%
LUTHERAN CHURCH
0.0%
0.3%
0.5%
1.1%
Weather
Philadelphia experiences traditional four-season weather. Winters can be cold and snowy, while summers are typically hot and humid. In contrast, Tampa enjoys a tropical climate with warm weather throughout the year. Winters are mild, and summers can be quite hot, with frequent thunderstorms.
Weather and climate
Type
Philadelphia
Tampa
Temperature - Average
54.8°F
73.1°F
Humidity - Average morning or afternoon humidity
69.9%
77.6%
Humidity - Differences between morning and afternoon humidity
34%
38%
Humidity - Maximum monthly morning or afternoon humidity
82%
89%
Humidity - Minimum monthly morning or afternoon humidity
48%
51%
Precipitation - Yearly average
45.7 in
45.6 in
Snowfall - Yearly average
45.1 in
0 in
Clouds - Number of days clear of clouds
15.4%
16.9%
Sunshine amount - Average
59.8%
74.8%
Sunshine amount - Differences during a year
18%
18%
Sunshine amount - Maximum monthly
63%
80%
Sunshine amount - Minimum monthly
45%
62%
Wind speed - Average
10 mph
7.4 mph
Average climate in Philadelphia, Pennsylvania
Average climate in Tampa, Florida
Air pollution
Type
AQI
CO
NO2
OZONE
PB
PM10
PM25
SO2
Year
Philadelphia
Tampa
Philadelphia
Tampa
Philadelphia
Tampa
Philadelphia
Tampa
Philadelphia
Tampa
Philadelphia
Tampa
Philadelphia
Tampa
Philadelphia
Tampa
2018
99
68
0.37
0.16
10.7
N/A
24.3
27.7
N/A
N/A
17.2
18.9
9.2
7.9
0.9
1.1
2017
105
79
0.32
0.17
11.0
N/A
25.3
28.4
0.004
N/A
22.3
20.5
8.9
8.8
1.0
0.6
2016
99
71
0.30
0.17
13.6
N/A
25.1
30.8
0.007
N/A
23.2
20.2
9.5
7.9
1.4
0.8
2015
110
74
0.34
0.15
15.8
N/A
22.6
28.7
0.007
N/A
23.9
19.0
10.5
10.0
1.8
2.2
2014
105
74
0.34
0.16
16.8
N/A
23.1
28.0
0.027
N/A
23.0
20.0
11.7
8.4
2.2
1.6
2013
105
68
0.27
0.16
16.7
N/A
22.5
27.7
0.029
N/A
31.0
20.3
10.5
9.3
1.5
1.4
2012
111
85
0.29
0.17
17.8
N/A
23.0
28.0
0.040
N/A
14.6
21.0
11.7
9.7
1.5
1.0
2011
113
83
0.28
0.18
19.9
N/A
24.3
29.2
0.039
N/A
16.9
20.8
9.8
10.1
1.9
1.2
2010
116
84
0.30
0.25
20.1
N/A
23.0
29.8
0.009
N/A
21.7
21.8
12.2
9.9
2.6
1.3
2009
95
77
0.32
0.27
18.9
N/A
19.7
27.4
0.011
N/A
18.0
21.2
11.9
10.1
2.9
1.5
2008
112
86
0.30
0.18
19.8
4.0
19.1
27.5
0.010
N/A
16.8
23.3
13.9
10.2
3.8
2.4
2007
128
102
0.42
0.31
21.6
5.4
23.3
28.8
0.019
N/A
17.5
26.0
12.3
12.0
4.2
3.3
2006
112
99
0.52
0.42
21.4
6.9
22.5
29.5
0.016
N/A
18.3
25.8
13.1
11.6
4.2
3.0
2005
108
99
0.58
0.45
24.4
6.7
20.8
27.9
0.018
N/A
19.7
25.0
N/A
13.2
5.0
3.0
2004
102
92
0.58
0.40
24.1
7.2
18.9
26.5
0.023
0.004
19.1
25.0
N/A
12.5
5.2
3.2
2003
103
94
0.62
0.42
23.8
N/A
19.7
23.8
0.034
0.004
19.6
23.9
N/A
11.7
5.4
4.4
2002
128
84
0.56
0.38
26.8
N/A
21.2
24.5
0.035
0.006
18.3
24.2
N/A
11.5
4.9
4.9
2001
119
100
0.63
0.44
27.9
N/A
20.0
26.2
0.014
0.012
20.6
24.9
N/A
12.1
5.6
4.7
2000
111
98
0.68
0.48
26.7
N/A
19.0
29.3
0.034
0.020
N/A
26.3
N/A
N/A
5.5
5.1
Natural disasters
Type
Philadelphia
Tampa
Tornado activity compared to U.S. average
96.6%
152.6%
Earthquake activity compared to U.S. average
34.4%
11.1%
Natural disasters compared to U.S. average
22%
25%
Transportation
Philadelphia has an extensive public transit system that includes buses, trains, and subways, easing the commute for many residents. Tampa's public transit consists mainly of buses, and the city is more car-dependent.
Transport
Type
Philadelphia
Tampa
Amtrak stations
2
1
Amtrak stations nearby
3
3
FAA registered aircraft
347
541
FAA registered aircraft manufacturers and dealers
2
78
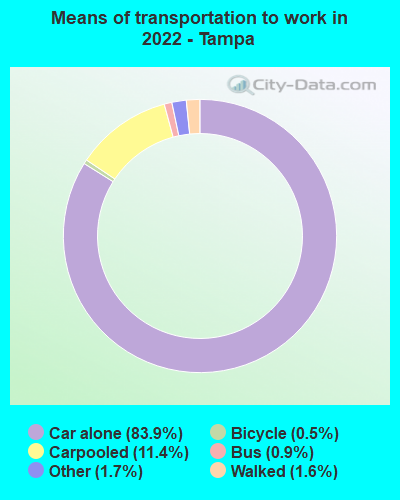
Means of transportation to work
Type
Philadelphia
Tampa
Bicycle
2%
0.4%
Bus
11.7%
1.1%
Carpooled
8.7%
8.5%
Car alone
60%
87%
Motorcycle
0.1%
0.2%
Railroad
0.7%
0.2%
Streetcar
4.2%
0%
Subway
2.8%
0%
Taxicab
0.2%
0.1%
Walked
7.8%
1.3%
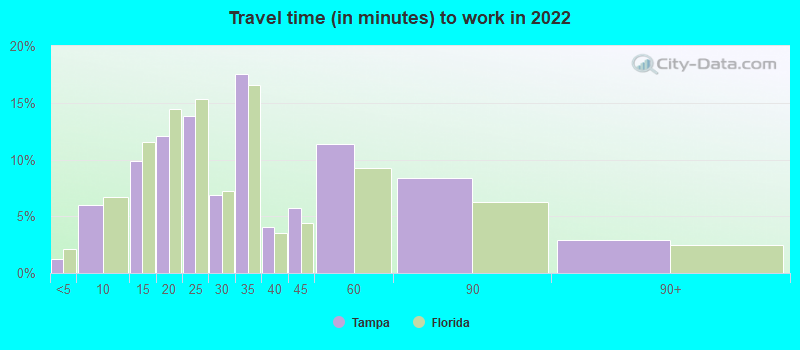
Average travel time to work
Type
Philadelphia
Tampa
Average
34.3 min
31.4 min
Other means
28.2 min
23.2 min
Public transportation
45.6 min
45.3 min
Private vehicle occupancy
Type
Philadelphia
Tampa
Average
1.2
1.1
Drove alone
86.4%
90.8%
In 2 person carpool
10.2%
6.1%
In 3 person carpool
2%
1.7%
In 4 person carpool
0.9%
0.8%
In 5-6 person carpool
0.3%
0.4%
In 7+ person carpool
0.2%
0.1%
How many people usually rode to work in the car, truck or van.
Real Estate
Real estate prices in Tampa are significantly lower than in Philadelphia. Both rent and home prices are more affordable in Tampa. Philadelphia, on the other hand, has seen significant increases in home prices, particularly in desirable neighborhoods.
Neighborhoods
Philadelphia's neighborhoods are diverse and unique, many with their own distinct culture and character. Tampa's residential areas offer a variety of lifestyle choices from waterfront, beach living to quiet suburban enclaves.
Houses and residents
Type
Philadelphia
Tampa
Houses
733,015
172,886
Average household size (people)
2.5
2.4
Median year apartment built
1953
1988
Median year house/condo built
1947
1977
Length of stay in the house since moving in
16 years
12.5 years
Houses occupied
660,921 (90.2%)
159,925 (92.5%)
Houses occupied by owners
348,935 (52.8%)
84,660 (52.9%)
Houses occupied by renters
311,986 (47.2%)
75,265 (47.1%)
Median rent asked for vacant for-rent units
$1,301
$1,369
Median monthly housing costs
$1,096
$1,326
Median price asked for vacant for-sale houses and condos
$260,453
$380,334
Estimated median house or condo value
$220,700
$336,200
Median numbers of rooms
5.5
4.9
Median number of rooms in apartments
4.2
3.9
Median number of rooms in houses and condos
6.2
6
Median house price - detached houses
$292,974
$477,728
Median house price - in 2-unit structures
$357,727
$191,392
Median house price - in 3-to-4-unit structures
$264,854
$249,678
Median house price - in 5 or more unit structures
$442,314
$443,026
Median house price - mobile homes
$163,609
$95,765
Median house price - Townhouses or other attached units
$239,791
$499,254
Median house price - All housing units
$256,324
$470,393
Median house age
73
38
Renting percentage
45.9%
48.3%
Housing density (houses/condos per square mile)
5,426.1
1,542.7
House value disparities
38.4%
34.7%
Household income disparities
49.5%
48.9%
Median household income for houses/condes with a mortgage
$86,108
$107,575
Median household income for apartments without a mortgage
$44,075
$66,260
Housing units without a mortgage
8,484 (4%)
1,024 (1.9%)
Housing units with both a second mortgage and home equity loan
18,029 (8.5%)
4,974 (9.2%)
Housing units with a mortgage
202,880 (96%)
53,063 (98.1%)
Housing units with a home equity loan
1,280 (0.6%)
110 (0.2%)
Housing units with a second mortgage
22,966 (10.9%)
5,716 (10.6%)
House/condo owner moved in on average (years ago)
15
8
House/condo renter moved in on average (years ago)
3
1
Housing units lacking complete kitchen facilities
3.7%
1.2%
Housing units lacking complete plumbing facilities
3.3%
0.9%
Housing units in structures
Housing units in structures
Philadelphia
Tampa
One, detached
9.9%
54.3%
One, attached
55.9%
7.1%
Two
7.4%
2.0%
3 or 4
6.7%
4.5%
5 to 9
2.8%
4.8%
10 to 19
2.5%
5.5%
20 to 49
3.1%
5.5%
50 or more
11.2%
15.1%
Mobile homes
0.3%
1.0%
Boats, RVs, vans, etc.
0.1%
0.0%
Median real estate property taxes paid for housing units
Self-employed workers in own not incorporated business
29,270
10,160
State government workers
16,901
6,101
Unpaid family workers
570
602
Industries and Occupations
Philadelphia is home to a range of industries including healthcare, education, food services, and biotechnology. Tampa's economy is more focused on tourism, healthcare, finance, and insurance services.
Both cities host a range of highly rated healthcare facilities. Philadelphia is known for its medical research and teaching hospitals, while Tampa offers excellent healthcare facilities with a focus on senior care and wellness.
Health (county statistics)
Type
Philadelphia
Tampa
General health status score of residents in this county from 1 (poor) to 5 (excellent)
Philadelphia's infrastructure reflects its historical significance, with many preserved historical sites and older residential buildings. Meanwhile, Tampa's infrastructure is more modern, with many new developments and a focus on sustainable building practices.
Infrastructure
Type
Philadelphia
Tampa
Hospitals
91
19
TV stations
24
26
Arenas or stadiums
7
3
Bank branches located here
329
205
Bank institutions located here
46
45
Main business address for public companies
47
24
Drinking water stations with no reported violations in the past
1
58
Drinking water stations with reported violations in the past
HMDA - Conventional home purchase loans - Applications denied
Year
Philadelphia
Tampa
1999
3,294
1,627
2000
3,202
1,292
2001
2,480
1,001
2002
2,012
968
2003
3,268
1,390
2004
4,525
2,093
2005
6,637
3,515
2006
7,517
4,460
2007
5,750
2,950
2008
2,745
1,075
2009
1,390
415
Culture and Food
Philadelphia is known for its rich history and varied food scene, with iconic dishes like cheesesteak. Tampa offers a mix of cultural influences, with a strong Hispanic influence reflected in its culinary scene and cultural events.
Sports Teams
Philadelphia is home to the Eagles (NFL), the 76ers (NBA), the Phillies (MLB), and the Flyers (NHL). Tampa hosts the Buccaneers (NFL), the Lightning (NHL), and the Rays (MLB). Both cities have passionate fan bases and offer lots of excitement for sports enthusiasts.


 Philadelphia, PA
 Tampa, FL