Portland, Oregon, and Kent, Washington, are two great West Coast cities with distinct features and attractions. Portland, known for its liberal tendencies, quirky culture, and enticing food scene, is larger and more urban in comparison to Kent, which offers a more laid-back atmosphere within reasonable commuting distance of Seattle. Comparing the two invites analysis across multiple facets including safety, climate, cost of living, education, job opportunities, infrastructure, and more.
Distance between
Portland, OR and
Kent, WA : 130.0 miles
Portland's population is larger by 376%. Its population has grown by 112,041 people (21.2%) since 2000. The population of Kent has grown by 55,311 people (69.6%) during that time.
Crime rates in both Portland and Kent are higher than the national average. However, the crime rate in Kent is lower than Portland, making it relatively safer. Both cities have similar property crime rates, but violent crime is higher in Portland. For tourists, it is recommended to stay in safer areas and be cautious, especially at night in both cities.
City-data.com crime index counts serious crimes and violent crime more heavily. It adjusts for the number of visitors and daily workers commuting into cities. (higher means more crime, U.S. average = 301.1)
City-data.com crime index counts serious crimes and violent crime more heavily. It adjusts for the number of visitors and daily workers commuting into cities. (higher means more crime, U.S. average = 301.1)
Sex Offenders
According to our data, there are 374 registered sex offenders living in Portland and 47 registered sex offenders living in . The ratio of residents to sex offenders in Portland is 1,710 to 1; the ratio in Kent is 2,713 to 1. The number of registered sex offenders compared to the number of residents is larger in Portland than in Kent.
Cost of Living
The cost of living in Portland is significantly higher than that in Kent, especially in terms of housing. Average home cost and rent are appreciably greater in Portland. Other basic expenses like groceries and healthcare are also generally more expensive in Portland as compared to Kent.
Income Tax
Oregon has a state income tax, while Washington State does not. For people earning higher incomes, this difference can be significant and make living in Kent financially more attractive.
Property Tax
Property taxes are lower in Kent compared to Portland. This could be another reason for homebuyers to prefer Kent over Portland.
Sales Tax
Kent has a higher sales tax than Portland. Interestingly, Oregon is one of five states in the US where no sales tax is levied, which could be a major selling point for some.
Income
Type
Portland
Kent
Estimated median household income
$79,057
$81,373
Estimated per capita income
$49,003
$36,357
Cost of living index (U.S. average is 100)
106.5
113.2
If you make $50,000 in Portland, you will have to make $53,146 in Kent to maintain the same standard of living.
Geographical Conditions
Both cities enjoy scenic geographical conditions – Kent, situated in the Green River Valley, flaunts beautiful views of Mount Rainier while Portland, demarcated by rivers and mountains, offers wonderful views of Mount Hood.
Kent, despite being the smaller city, carries a strong reputation for education, with schools that perform above the national average. Portland's education system is larger and more varied, with plenty of options but also wider range in quality, especially at the elementary level.
Both Portland and Kent have strong economies. Portland is known for having a 'hipster' economy, with an emphasis on local and organic businesses. Kent's economy is more industrial, with a lot of jobs in manufacturing and commercial sectors. Unemployment rates are comparable, slightly favoring Kent.
Biggest Employers
In Portland, some of the biggest employers include Intel, Providence Health & Services, and Nike. In Kent, big employers are Boeing, Amazon, and REI. Thus, while Kent offers impressive opportunities in manufacturing and e-commerce, Portland is more diverse.
There were 474 building permits issued in Portland in 2012 (23 more than in 2011) compared to 343 building permits issued in Kent in 2012 (90 more than in 2011).
In Portland (Multnomah County), 75.4% voted for Democrats and 20.6% for Republicans in 2012 Presidential Election. In Kent (King County), 69.0% voted for Democrats and 28.5% for Republicans.
Elections
Type
Democrats
Republicans
Other
Year
Portland
Kent
Portland
Kent
Portland
Kent
2020
79.2%
75.1%
17.9%
22.3%
2.9%
2.6%
2016
73.3%
70.0%
17.0%
21.1%
9.7%
8.9%
2012
75.4%
69.0%
20.6%
28.5%
4.0%
2.5%
2008
76.7%
70.2%
20.6%
28.1%
2.7%
1.7%
2004
71.6%
65.1%
27.1%
33.8%
1.3%
1.1%
2000
63.8%
60.3%
28.3%
34.5%
7.9%
5.2%
1996
59.2%
56.4%
26.3%
31.4%
14.4%
12.2%
Breakdown of population affiliated with a religious congregation
Type
Adherents
Congregations
Religion
Portland
Kent
Portland
Kent
CATHOLIC CHURCH
15.2%
14.4%
6.7%
4.9%
EVANGELICAL LUTHERAN CHURCH IN AMERICA
0.9%
1.3%
4.0%
4.7%
SEVENTH DAY ADVENTIST CHURCH
0.9%
0.6%
3.4%
2.3%
AMERICAN BAPTIST CHURCHES IN THE USA
0.8%
0.6%
2.7%
2.9%
EPISCOPAL CHURCH
0.7%
0.8%
2.2%
2.4%
SOUTHERN BAPTIST CONVENTION
0.5%
0.3%
3.8%
3.8%
LUTHERAN CHURCH
0.4%
0.5%
2.2%
2.0%
MUSLIM ESTIMATE
0.3%
0.6%
1.0%
1.4%
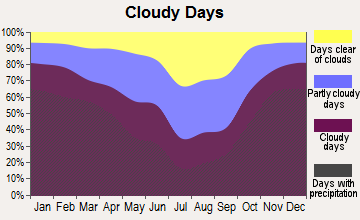
Weather
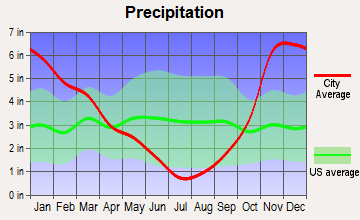
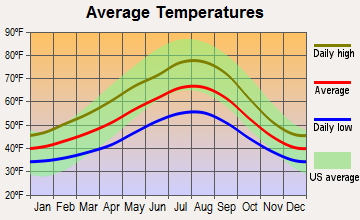
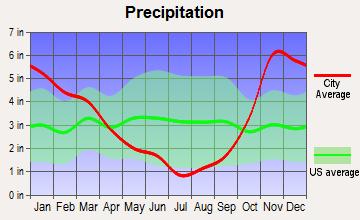
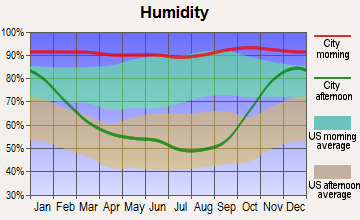
Both cities have a similar climate, as they both lie in the Pacific Northwest. They experience mild, wet winters and warm, dry summers. Portland tends to have slightly warmer weather overall, while rainfall is comparable in both cities. Both cities would be ideal for those who enjoy a temperate climate with plenty of opportunities for outdoor activities.
Weather and climate
Type
Portland
Kent
Temperature - Average
53.9°F
52.8°F
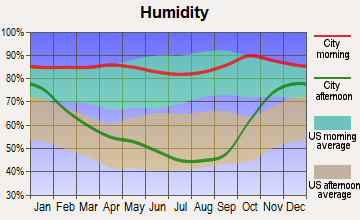
Humidity - Average morning or afternoon humidity
76.5%
78.5%
Humidity - Differences between morning and afternoon humidity
42%
38%
Humidity - Maximum monthly morning or afternoon humidity
86%
86%
Humidity - Minimum monthly morning or afternoon humidity
44%
48%
Precipitation - Yearly average
41.6 in
39.3 in
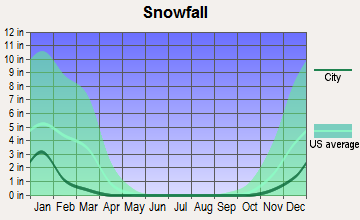
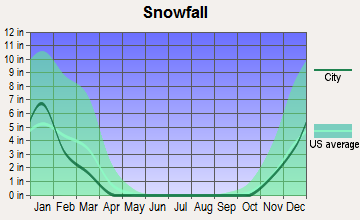
Snowfall - Yearly average
12.8 in
21.4 in
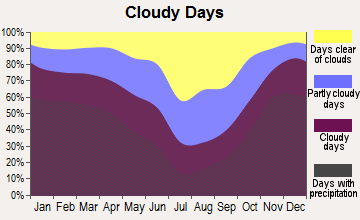
Clouds - Number of days clear of clouds
11.3%
9.7%
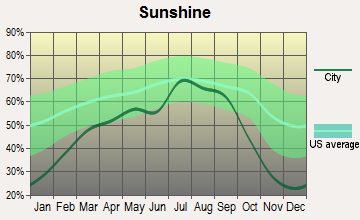
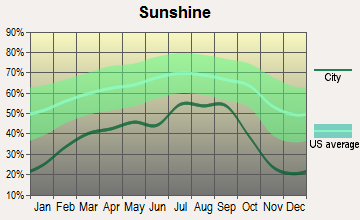
Sunshine amount - Average
54.7%
49.4%
Sunshine amount - Differences during a year
52%
44%
Sunshine amount - Maximum monthly
72%
64%
Sunshine amount - Minimum monthly
20%
20%
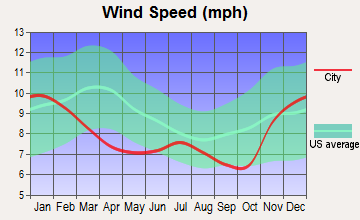
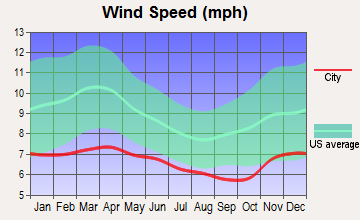
Wind speed - Average
8.1 mph
8.6 mph
Average climate in Portland, Oregon
Average climate in Kent, Washington
Air pollution
Type
AQI
CO
NO2
OZONE
PB
PM10
PM25
SO2
Year
Portland
Kent
Portland
Kent
Portland
Kent
Portland
Kent
Portland
Kent
Kent
Portland
Kent
Portland
Kent
2018
79
90
0.26
0.21
8.8
10.6
21.4
21.2
N/A
N/A
N/A
N/A
7.2
7.3
0.4
0.7
2017
93
112
0.26
0.23
8.7
11.1
22.6
21.6
N/A
N/A
N/A
N/A
7.1
7.7
0.4
0.3
2016
72
78
0.25
0.22
8.7
11.9
20.8
20.3
N/A
N/A
N/A
N/A
5.2
5.6
0.2
0.6
2015
91
98
0.28
0.23
9.2
10.8
20.1
19.8
N/A
N/A
N/A
N/A
7.4
6.7
0.5
0.8
2014
91
82
0.24
0.24
8.5
11.5
21.0
20.1
N/A
N/A
N/A
N/A
6.3
6.1
0.8
N/A
2013
85
89
0.29
0.24
9.6
N/A
17.9
17.6
N/A
N/A
N/A
N/A
8.6
7.2
1.1
0.8
2012
78
94
0.30
0.23
9.1
N/A
21.0
19.8
N/A
N/A
N/A
N/A
7.4
6.6
0.6
1.0
2011
89
92
0.34
0.24
9.4
N/A
18.5
19.0
N/A
N/A
N/A
N/A
8.1
7.7
0.8
1.1
2010
80
70
0.33
0.24
9.1
N/A
19.4
18.3
N/A
N/A
N/A
N/A
6.4
6.8
1.4
1.1
2009
95
95
0.32
0.27
10.2
N/A
20.0
18.7
N/A
N/A
N/A
N/A
8.4
9.6
1.6
1.4
2008
101
93
0.34
0.30
10.9
N/A
19.2
18.3
N/A
N/A
N/A
N/A
8.8
9.7
1.0
1.3
2007
101
100
0.35
0.30
11.4
N/A
18.1
18.2
N/A
N/A
14.7
N/A
8.8
9.6
1.3
1.5
2006
106
113
N/A
N/A
N/A
N/A
N/A
19.8
N/A
N/A
16.1
N/A
7.8
9.8
1.5
N/A
2005
96
99
N/A
0.78
N/A
18.3
N/A
N/A
N/A
N/A
17.5
N/A
8.9
10.2
1.7
3.5
2004
92
118
N/A
0.78
N/A
17.9
N/A
N/A
N/A
N/A
N/A
N/A
9.8
10.5
N/A
3.0
2003
77
111
N/A
0.75
N/A
17.9
N/A
N/A
0.008
N/A
N/A
N/A
8.6
10.1
N/A
2.4
2002
68
97
N/A
0.82
N/A
19.3
N/A
N/A
0.010
N/A
N/A
N/A
8.4
10.6
N/A
2.7
2001
73
101
N/A
0.86
N/A
20.8
N/A
N/A
0.008
0.004
N/A
N/A
8.9
11.1
N/A
3.7
2000
52
101
N/A
1.03
N/A
21.0
N/A
N/A
N/A
N/A
N/A
N/A
N/A
12.2
N/A
3.2
Natural disasters
Type
Portland
Kent
Tornado activity compared to U.S. average
8.4%
5.5%
Earthquake activity compared to U.S. average
1,575.5%
1,454%
Natural disasters compared to U.S. average
9%
30%
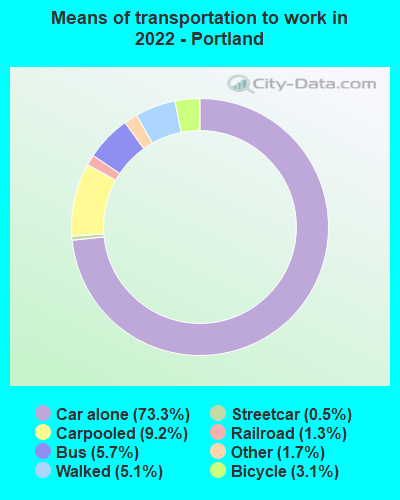
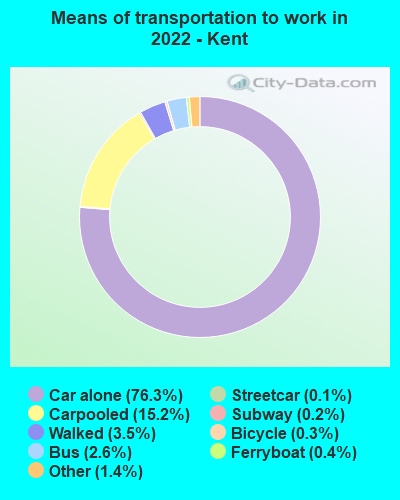
Transportation
Portland's public transport system is more robust, with a comprehensive network of buses, light rail, and streetcars. Kent relies largely on buses for public transportation, but many people commute to Seattle for work, which can take time, especially during peak hours.
Transport
Type
Portland
Kent
Amtrak stations
1
0
Amtrak stations nearby
3
2
FAA registered aircraft
804
198
FAA registered aircraft manufacturers and dealers
6
2
Means of transportation to work
Type
Portland
Kent
Bicycle
3.1%
0.4%
Bus
4.6%
2.3%
Carpooled
9.4%
11.2%
Car alone
76.2%
82.3%
Motorcycle
0.2%
0.1%
Railroad
0.9%
0%
Streetcar
0.3%
0%
Subway
0%
0.5%
Walked
3.8%
1.5%
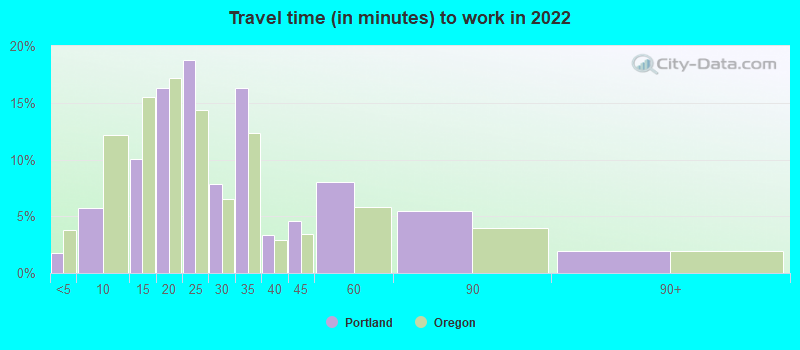
Average travel time to work
Type
Portland
Kent
Average
28.8 min
32.1 min
Other means
21.8 min
28.7 min
Public transportation
38.2 min
52.4 min
Private vehicle occupancy
Type
Portland
Kent
Average
1.2
1.2
Drove alone
88.2%
86.9%
In 2 person carpool
8.4%
10%
In 3 person carpool
1.6%
1.1%
In 4 person carpool
0.8%
0.3%
In 5-6 person carpool
0.6%
1.2%
In 7+ person carpool
0.4%
0.1%
How many people usually rode to work in the car, truck or van.
Real Estate
Real-estate prices in Portland are significantly higher than those in Kent, whether you're buying or renting. Thus, for those looking for cheaper real-estate options, Kent is the better choice.
Neighborhoods
Portland offers a fantastic variation of neighborhoods each with unique vibe and culture. Kent has more of a small-town feel, with neighborhoods that are more uniform but also less crowded and quieter.
Houses and residents
Type
Portland
Kent
Houses
303,483
47,926
Average household size (people)
2.3
2.7
Median year apartment built
1976
1983
Median year house/condo built
1954
1986
Length of stay in the house since moving in
12.1 years
10.7 years
Houses occupied
286,734 (94.5%)
46,036 (96.1%)
Houses occupied by owners
153,121 (53.4%)
26,144 (56.8%)
Houses occupied by renters
133,613 (46.6%)
19,892 (43.2%)
Median rent asked for vacant for-rent units
$1,917
$1,355
Median monthly housing costs
$1,535
$1,703
Median price asked for vacant for-sale houses and condos
$248,225
$337,039
Estimated median house or condo value
$520,200
$523,000
Median numbers of rooms
4.8
5.4
Median number of rooms in apartments
3.4
4.2
Median number of rooms in houses and condos
6.2
6.3
Median house price - detached houses
$568,464
$572,200
Median house price - in 3-to-4-unit structures
$426,181
$294,142
Median house price - in 5 or more unit structures
$466,898
$289,204
Median house price - mobile homes
$136,996
$84,109
Median house price - Townhouses or other attached units
$416,951
$370,457
Median house price - All housing units
$544,799
$515,556
Median house age
56
36
Renting percentage
46.3%
49.6%
Housing density (houses/condos per square mile)
2,259.4
1,709.6
House value disparities
23.1%
23.7%
Household income disparities
44.7%
40.3%
Median household income for houses/condes with a mortgage
$122,948
$125,990
Median household income for apartments without a mortgage
$72,663
$75,365
Housing units without a mortgage
2,404 (2.2%)
304 (1.6%)
Housing units with both a second mortgage and home equity loan
11,239 (10.1%)
1,292 (6.8%)
Housing units with a mortgage
108,864 (97.8%)
18,682 (98.4%)
Housing units with a home equity loan
396 (0.4%)
0 (0%)
Housing units with a second mortgage
12,832 (11.5%)
1,397 (7.4%)
House/condo owner moved in on average (years ago)
9
9
House/condo renter moved in on average (years ago)
1
1
Housing units lacking complete kitchen facilities
1.2%
1%
Housing units lacking complete plumbing facilities
0.9%
0.4%
Housing units in structures
Housing units in structures
Portland
Kent
One, detached
53.3%
53.0%
One, attached
5.7%
6.4%
Two
3.5%
1.3%
3 or 4
4.5%
3.9%
5 to 9
4.0%
9.8%
10 to 19
4.7%
12.2%
20 to 49
6.6%
3.7%
50 or more
16.2%
7.4%
Mobile homes
1.2%
2.3%
Boats, RVs, vans, etc.
0.3%
0.0%
Median real estate property taxes paid for housing units
Self-employed workers in own not incorporated business
25,437
5,752
State government workers
15,615
2,458
Unpaid family workers
688
83
Industries and Occupations
Portland has a diverse economy unfolding sectors like high tech, food services, healthcare, and clothing retailers. On the other hand, Kent is more concentrated on manufacturing, retail, healthcare, and education.
Portland has numerous hospitals and healthcare facilities, most notable being the Oregon Health & Science University. Kent, while having fewer healthcare centers, offers quality care, with the Multicare Kent Clinic and the Valley Medical Center being major facilities.
Health (county statistics)
Type
Portland
Kent
General health status score of residents in this county from 1 (poor) to 5 (excellent)
Portland, being a larger city, boasts more developed infrastructure with a wide range of attractions and amenities. Kent's infrastructure is less developed, but still capable of supporting a comfortable lifestyle with all necessary amenities.
Infrastructure
Type
Portland
Kent
TV stations
18
17
Bank branches located here
208
27
Bank institutions located here
30
15
Main business address for public companies
32
1
Drinking water stations with no reported violations in the past
2
0
Drinking water stations with reported violations in the past
HMDA - Conventional home purchase loans - Applications denied
Year
Portland
Kent
1999
1,922
270
2000
1,651
133
2001
1,193
101
2002
1,235
91
2003
1,844
279
2004
2,651
378
2005
3,396
593
2006
3,510
639
2007
3,008
475
2008
1,465
138
2009
712
70
Culture and Food
In terms of culture and food, Portland arguably outshines Kent. Known for its vibrant food scene and rich culture, Portland offers a variety of dining options and cultural activities. Kent, while certainly having a decent array of restaurants and cultural events, is less diverse.
Sports Teams
Portland is home to the NBA's Trail Blazers and the MLS' Timbers, drawing large, enthusiastic crowds. Kent is home to the minor league baseball team, the Kent Bulldogs, and the Seattle Thunderbirds of the WHL.


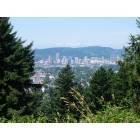


 Portland, OR
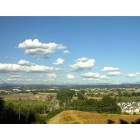
 Kent, WA