This comprehensive comparison between Queens, NY, and El Paso, TX, is essential for individuals considering relocating or tourists planning visits. This detailed overview spans various sectors, including crime and safety, weather, cost of living, education, work and economy, infrastructure, and many more. Both cities have unique attributes and distinct characteristics, making them suitable for diverse individuals and lifestyles. Here's a relatable, exhaustive comparison to help you make informed decisions.
Queens, NY, is generally safer than many larger cities, albeit with crime rates higher than the national average. Neighborhoods like Ridgewood, Forest Hills, and Bayside are considered relatively safe. Conversely, El Paso boasts one of the lowest crime rates for a major city in the U.S. Despite sharing a border with Mexico, it consistently receives Safe City awards.
Cost of Living
Living in Queens is significantly more expensive than in El Paso across almost all categories, including housing, groceries, transportation, and health care. El Paso is considered one of the most affordable major cities in the U.S.
Income Tax
New York City, including Queens, levies a city income tax ranging from 3.078% to 3.876%. Texas, including El Paso, has no state income tax.
Property Tax
Queens has an effective property tax rate of 0.90%, while El Paso's property tax rate tends to be higher, with an average of 2.27%.
Sales Tax
New York City's sales tax is 8.875%, including a 4.5% city tax. Texas has a 6.25% state sales tax, with El Paso adding on 2% for a total of 8.25%.
Income
Type
Queens
El Paso
Estimated median household income
$73,262
$51,241
Estimated per capita income
$34,969
$25,670
Cost of living index (U.S. average is 100)
173.2
82.2
If you make $50,000 in El Paso, you will have to make $105,353 in Queens to maintain the same standard of living.
Geographical Conditions
Queens resides on Long Island, characterized by its urban setting and proximity to water. El Paso is a desert city, surrounded by mountains and the Rio Grande, offering picturesque landscapes.
Geographical information
Type
Queens
El Paso
Land area
109.2 sq. miles
249.1 sq. miles
Population density
20,847 people per sq. mile
2,723.7 people per sq. mile
Relative area comparison
Queens, NY El Paso, TX
Education
Queens is home to a diverse range of quality public and private schools and several universities, including Queens College and St. John's University. El Paso also has respected schools and the University of Texas at El Paso. However, Queens generally has a higher level of educational attainment.
Queens benefits from New York City's robust economy, with key sectors including healthcare, retail trade, and construction. El Paso's economy relies heavily on federal government jobs, healthcare, education, and manufacturing.
Biggest Employers
Queens' biggest employers include JetBlue Airways, Bulova, and the NYC Health + Hospitals/Elmhurst. El Paso's top employers are the Fort Bliss Army Base, the University of Texas at El Paso, and school districts.
In Queens (Queens County), 79.2% voted for Democrats and 20.0% for Republicans in 2012 Presidential Election. In El Paso (El Paso County), 65.5% voted for Democrats and 33.2% for Republicans.
Elections
Type
Democrats
Republicans
Other
Year
Queens
El Paso
Queens
El Paso
Queens
El Paso
2020
72.3%
66.8%
27.0%
31.6%
0.7%
1.6%
2016
75.4%
69.1%
21.8%
26.0%
2.8%
4.9%
2012
79.2%
65.5%
20.0%
33.2%
0.8%
1.3%
2008
75.4%
66.0%
24.3%
33.4%
0.3%
0.6%
2004
71.8%
56.2%
27.5%
43.3%
0.8%
0.5%
2000
75.2%
57.9%
22.0%
39.8%
2.8%
2.3%
1996
72.9%
62.3%
21.1%
32.1%
6.0%
5.6%
Breakdown of population affiliated with a religious congregation
Type
Adherents
Congregations
Religion
Queens
El Paso
Queens
El Paso
CATHOLIC CHURCH
30.4%
43.2%
7.7%
11.3%
MUSLIM ESTIMATE
3.7%
0.1%
4.4%
0.2%
SEVENTH DAY ADVENTIST CHURCH
0.6%
0.3%
3.4%
1.6%
AMERICAN BAPTIST CHURCHES IN THE USA
0.5%
0.0%
2.5%
0.0%
EPISCOPAL CHURCH
0.4%
0.1%
2.1%
1.0%
EVANGELICAL LUTHERAN CHURCH IN AMERICA
0.3%
0.1%
2.6%
1.0%
SOUTHERN BAPTIST CONVENTION
0.2%
3.3%
3.8%
26.6%
Weather
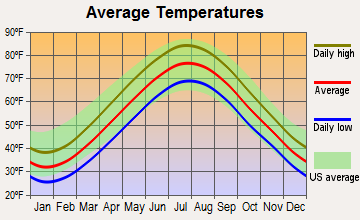
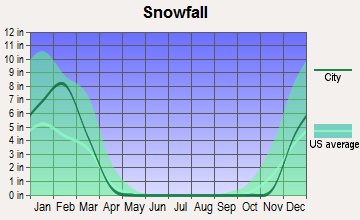
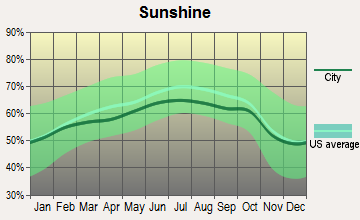
Queens experiences a humid subtropical climate with hot, humid summers and cold winters. It's susceptible to coastal storms and occasionally heavy snowfall. El Paso, on the other hand, enjoys a hot desert climate with mild, short winters and long, hot summers. It's many days of sunshine make it a 'Sun City.'
Weather and climate
Type
Queens
El Paso
Temperature - Average
54.6°F
64.6°F
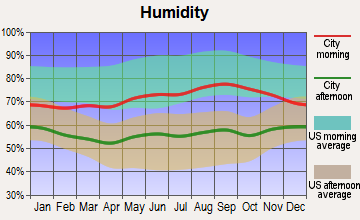
Humidity - Average morning or afternoon humidity
68.5%
42.7%
Humidity - Differences between morning and afternoon humidity
25.1%
42.8%
Humidity - Maximum monthly morning or afternoon humidity
76.3%
59.8%
Humidity - Minimum monthly morning or afternoon humidity
51.1%
17%
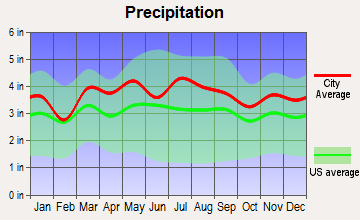
Precipitation - Yearly average
44.5 in
9.4 in
Snowfall - Yearly average
52.7 in
10.7 in
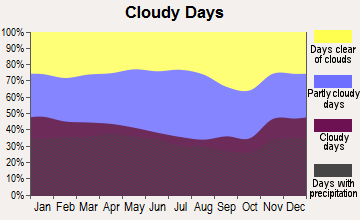
Clouds - Number of days clear of clouds
16.3%
31.8%
Sunshine amount - Average
60.2%
89.4%
Sunshine amount - Differences during a year
20%
13.9%
Sunshine amount - Maximum monthly
64%
89.3%
Sunshine amount - Minimum monthly
44%
75.4%
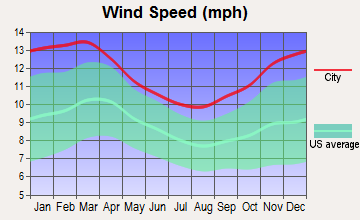
Wind speed - Average
11.6 mph
8.9 mph
Average climate in Queens, New York
Average climate in El Paso, Texas
Air pollution
Type
AQI
CO
NO2
OZONE
PB
PM10
PM25
SO2
Year
Queens
El Paso
Queens
El Paso
Queens
El Paso
Queens
El Paso
Queens
El Paso
Queens
El Paso
Queens
El Paso
Queens
El Paso
2018
97
139
0.26
0.17
14.7
14.0
25.4
32.0
N/A
N/A
N/A
35.7
6.4
9.2
0.4
N/A
2017
98
173
0.23
0.19
15.4
13.0
25.8
30.5
N/A
N/A
N/A
40.4
6.4
9.5
0.5
0.5
2016
97
148
0.24
0.17
16.0
12.6
25.5
30.6
N/A
N/A
N/A
35.2
6.7
9.2
0.6
0.5
2015
104
112
0.26
0.18
17.4
12.7
24.1
30.8
N/A
N/A
N/A
31.2
7.9
8.0
0.8
0.5
2014
99
157
0.25
0.13
17.0
12.8
24.3
30.0
N/A
N/A
N/A
40.3
7.8
9.7
1.1
0.4
2013
101
211
0.23
0.23
17.7
14.1
25.8
30.5
N/A
N/A
N/A
43.9
8.7
10.8
1.2
0.4
2012
105
229
0.26
0.30
17.6
15.9
25.8
31.6
N/A
N/A
N/A
40.2
9.1
11.6
1.8
0.4
2011
112
221
0.27
0.23
20.4
15.9
24.2
31.2
N/A
N/A
N/A
34.7
10.6
11.6
2.7
0.5
2010
112
211
0.35
0.25
19.4
15.3
23.6
29.4
N/A
N/A
N/A
28.8
10.3
7.9
2.9
0.3
2009
107
117
0.24
0.23
21.0
15.4
21.0
29.5
N/A
N/A
N/A
28.6
9.7
8.3
3.4
0.3
2008
113
210
0.44
0.25
22.6
15.2
22.0
30.1
0.013
0.017
N/A
34.6
11.0
9.7
4.1
0.6
2007
121
134
0.46
0.28
22.9
13.9
20.2
30.6
0.016
0.019
N/A
40.5
11.6
8.4
4.9
0.4
2006
120
241
0.46
0.37
23.5
14.3
20.3
30.6
0.018
0.018
N/A
55.0
12.7
11.1
5.3
0.3
2005
110
159
0.54
0.43
25.5
13.1
19.7
29.6
N/A
0.013
N/A
44.5
N/A
9.6
6.7
0.6
2004
107
183
0.55
0.38
25.1
13.5
18.2
29.2
0.030
0.020
N/A
47.3
N/A
8.2
5.8
0.4
2003
110
278
0.63
0.46
26.9
15.5
18.9
29.5
0.022
0.039
26.9
60.4
N/A
10.8
7.0
0.6
2002
124
203
0.58
0.43
27.9
16.4
19.2
30.5
0.008
0.034
25.7
53.3
N/A
11.0
6.5
0.4
2001
124
139
0.60
0.51
28.8
15.5
19.3
28.7
0.020
0.046
24.5
N/A
N/A
9.8
7.8
0.7
2000
115
145
0.67
0.67
28.4
17.8
17.6
27.8
0.022
0.072
22.2
N/A
N/A
9.1
7.3
1.0
Natural disasters
Type
Queens
El Paso
Tornado activity compared to U.S. average
54%
4.2%
Earthquake activity compared to U.S. average
30.6%
524.4%
Natural disasters compared to U.S. average
19%
11%
Transportation
Public transit is highly efficient in Queens via MTA subways and buses, and the average commute time is relatively high. El Paso relies more on car commutes, with a shorter average commute time but less-developed public transit.
Transport
Type
Queens
El Paso
Amtrak stations
2
1
Amtrak stations nearby
3
1
FAA registered aircraft
4
331
FAA registered aircraft manufacturers and dealers
0
6
Means of transportation to work
Type
Queens
El Paso
Bicycle
0.3%
0.3%
Bus
10%
1.3%
Carpooled
10.2%
11.2%
Car alone
34.3%
83.4%
Motorcycle
0%
0.2%
Railroad
2.2%
0%
Streetcar
0.2%
0%
Subway
34.3%
0%
Taxicab
0.7%
0.1%
Walked
5.7%
1.6%
Average travel time to work
Type
Queens
El Paso
Average
44 min
25.1 min
Real Estate
Real estate in Queens is drastically more expensive than in El Paso. Queens offers diverse housing options from apartments to private homes. El Paso is known for its affordable housing, with numerous single-family homes.
Neighborhoods
Queens boasts diverse neighborhoods, from the bustling Flushing to the suburban Bayside. El Paso has a variety of neighborhoods too, like the historic Sunset Heights and the lively Kern Place.
Houses and residents
Type
Queens
El Paso
Houses
817,250
261,779
Average household size (people)
2.8
3
Houses occupied
782,664 (95.8%)
242,529 (92.6%)
Houses occupied by owners
334,894 (42.8%)
147,788 (60.9%)
Houses occupied by renters
447,770 (57.2%)
94,741 (39.1%)
Median rent asked for vacant for-rent units
$1,666
$570.82
Median price asked for vacant for-sale houses and condos
$615,765
$227,007
Estimated median house or condo value
$642,000
$152,800
Median number of rooms in apartments
3.7
4.3
Median number of rooms in houses and condos
5.4
6.2
Renting percentage
57%
39.6%
Housing density (houses/condos per square mile)
7,481.6
1,051
Household income disparities
44.9%
46.6%
Housing units without a mortgage
64,617 (34.6%)
1,889 (2.2%)
Housing units with both a second mortgage and home equity loan
311 (0.2%)
2,956 (3.4%)
Housing units with a mortgage
122,366 (65.4%)
84,973 (97.8%)
Housing units with a home equity loan
9,927 (5.3%)
250 (0.3%)
Housing units with a second mortgage
10,707 (5.7%)
3,635 (4.2%)
Housing units lacking complete kitchen facilities
1%
2%
Housing units lacking complete plumbing facilities
Self-employed workers in own not incorporated business
48,383
19,650
State government workers
21,536
12,525
Unpaid family workers
2,382
901
Industries and Occupations
The predominant industries in Queens include healthcare & social assistance, retail trade, and educational services. In El Paso, the largest sectors are Healthcare and Social Assistance, Retail Trade, and Educational Services.
Queens is part of New York City's extensive healthcare network, with renowned healthcare institutions. Despite being smaller, El Paso also has competent healthcare facilities, including several hospitals and specialist centers.
Health (county statistics)
Type
Queens
El Paso
General health status score of residents in this county from 1 (poor) to 5 (excellent)
Queens offers well-established infrastructure, with easy accessibility to airports, rail, and roads. El Paso's infrastructures are improving, but public transportation isn't as efficient compared to Queens.
Infrastructure
Type
Queens
El Paso
Hospitals
1
41
TV stations
30
10
Schools
School facilities
Type
Queens
El Paso
Private elementary/middle schools
8
22
Private high schools
1
16
Public elementary/middle schools
6
174
Public high schools
2
53
Colleges/Universities
1
18
Culture and Food
Queens offers diverse cultural experiences and an array of international cuisine due to its ethnically diverse population. El Paso presents rich Mexican-American culture and cuisine, particularly famous for its Mexican food and Tex-Mex offerings.
Sports Teams
Queens is home to the New York Mets (MLB) and directly accessible to many other NYC teams. El Paso houses the El Paso Chihuahuas (MiLB) and is especially known for its collegiate sports teams, mainly UTEP.
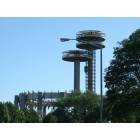


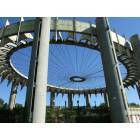


 Queens, NY
 El Paso, TX