Queens and Staten Island are two of New York's five boroughs. They each boast unique characteristics, creating diverse living experiences for residents and vastly different impressions for visitors. Anchored in rich history, infused with cultural diversity, and embracing urban development with an eye to the future, these boroughs hold distinctive appeals. This article discusses important factors to consider when comparing living or visiting Queens and Staten Island.
While both Staten Island and Queens are generally considered safe places to live, crime rates can vary from neighborhood to neighborhood. Queens has a low crime rate relative to the rest of New York City. It is family-friendly and considered a safer borough compared to Manhattan, Brooklyn, and the Bronx. Staten Island, though smaller, also presents a lower crime rate, often attributed to its significant population of police and firefighter residents. The sense of community imbued in its small-town feel adds to the safety factor.
Cost of Living
New York City is known for its high cost of living, but Staten Island usually has lower living costs as compared to Queens. Rent and home prices are generally less expensive, and daily expense items like groceries and transportation also carry lower price tags. Conversely, Queens, with its close proximity to Manhattan, has a higher cost of living, attracting people looking for a more urban living experience.
Income Tax
Residents of both boroughs are subject to the same New York city and state income taxes, which can range from 4% to 8.82% on state-level and from 3.078% to 3.876% on the city level, depending on income.
Property Tax
Property tax rates can vary significantly between Queens and Staten Island. While Staten Island generally has lower property values, its property tax rate is higher than Queens. Prospective homeowners should consider this factor when making their decisions.
Sales Tax
Both boroughs are subject to New York City's 8.875% sales tax, which includes the New York state sales tax of 4%, Metropolitan Commuter Transportation District surcharge of 0.375%, and the New York City sales tax of 4.5%.
Income
Type
Queens
Staten Island
Estimated median household income
$73,262
$86,054
Estimated per capita income
$34,969
$38,678
Cost of living index (U.S. average is 100)
173.2
164.1
If you make $50,000 in Staten Island, you will have to make $52,773 in Queens to maintain the same standard of living.
Geographical Conditions
Queens sits on Long Island and benefits from proximity to both Nassau County and Manhattan. Staten Island, to the southwest, is less dense with rolling hills and quite a few parks making it suitable for those seeking outdoor activities.
Geographical information
Type
Queens
Staten Island
Land area
109.2 sq. miles
58.5 sq. miles
Population density
20,847 people per sq. mile
8,225.7 people per sq. mile
Relative area comparison
Queens, NY Staten Island, NY
Education
Both boroughs have a multitude of public, private, and parochial school options. Queens, due to its size and diversity, has a much broader array of educational programs, including a substantial number of bilingual schools. Both have access to excellent universities, with Queens being home to renowned academic institutions like Queens College and St. John’s University.
Queens’ economy is vibrant and diverse, with industries including healthcare, retail trade, manufacturing, construction, and transport. Conversely, Staten Island has a lesser diversity in its economic mix, with the majority of its residents commuting to work in other boroughs, mainly Manhattan.
Biggest Employers
In Queens, the biggest employers are the healthcare sector with Northwell Health, followed by JetBlue Airways Corporation and Mount Sinai Services. On Staten Island, Richmond University Medical Center, Staten Island University Hospital and The City of New York are the largest employers.
In Queens (Queens County), 79.2% voted for Democrats and 20.0% for Republicans in 2012 Presidential Election. In Staten Island (Richmond County), 50.8% voted for Democrats and 48.3% for Republicans.
Elections
Type
Democrats
Republicans
Other
Year
Queens
Staten Island
Queens
Staten Island
Queens
Staten Island
2020
72.3%
42.2%
27.0%
57.1%
0.7%
0.7%
2016
75.4%
41.0%
21.8%
56.1%
2.8%
2.9%
2012
79.2%
50.8%
20.0%
48.3%
0.8%
0.9%
2008
75.4%
47.8%
24.3%
51.9%
0.3%
0.4%
2004
71.8%
42.8%
27.5%
56.5%
0.8%
0.7%
2000
75.2%
52.1%
22.0%
45.1%
2.8%
2.9%
1996
72.9%
50.5%
21.1%
40.8%
6.0%
8.7%
Breakdown of population affiliated with a religious congregation
Type
Adherents
Congregations
Religion
Queens
Staten Island
Queens
Staten Island
CATHOLIC CHURCH
30.4%
54.2%
7.7%
20.6%
MUSLIM ESTIMATE
3.7%
1.7%
4.4%
3.0%
SEVENTH DAY ADVENTIST CHURCH
0.6%
0.1%
3.4%
2.5%
AMERICAN BAPTIST CHURCHES IN THE USA
0.5%
0.6%
2.5%
1.0%
EPISCOPAL CHURCH
0.4%
0.4%
2.1%
5.0%
EVANGELICAL LUTHERAN CHURCH IN AMERICA
0.3%
0.6%
2.6%
4.0%
COPTIC ORTHODOX CHURCH
0.2%
0.5%
0.2%
1.0%
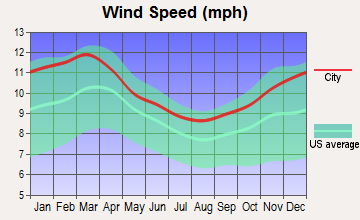
Weather
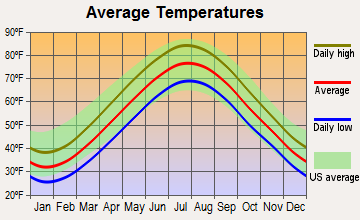
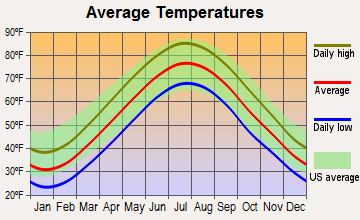
Both boroughs experience a typical Northeastern U.S. climate. Winters can get cold, with January temperatures averaging in the mid-30s (°F). Summers are hot, with July temperatures averaging in the mid-80s. Spring and fall are pleasant, arguably the best seasons for tourists. Staten Island, being less urban and more forested, tends to be a few degrees cooler than Queens.
Weather and climate
Type
Queens
Staten Island
Temperature - Average
54.6°F
54.1°F
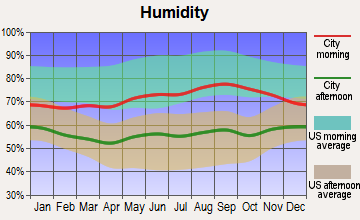
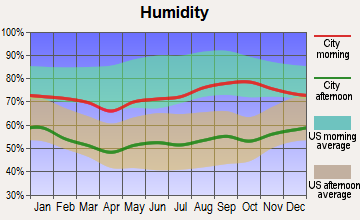
Humidity - Average morning or afternoon humidity
68.5%
67.4%
Humidity - Differences between morning and afternoon humidity
25.1%
29.9%
Humidity - Maximum monthly morning or afternoon humidity
76.3%
77%
Humidity - Minimum monthly morning or afternoon humidity
51.1%
47.2%
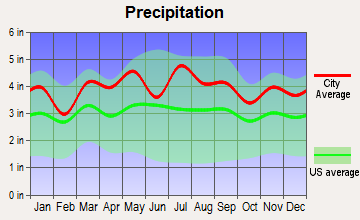
Precipitation - Yearly average
44.5 in
47.4 in
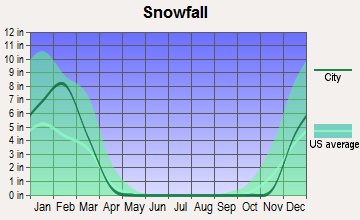
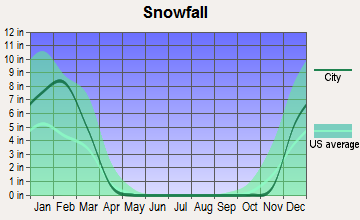
Snowfall - Yearly average
52.7 in
60 in
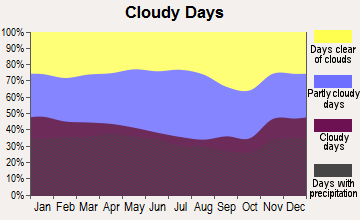
Clouds - Number of days clear of clouds
16.3%
15.8%
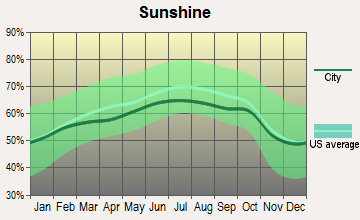
Sunshine amount - Average
60.2%
60.2%
Sunshine amount - Differences during a year
20%
20%
Sunshine amount - Maximum monthly
64%
64%
Sunshine amount - Minimum monthly
44%
44%
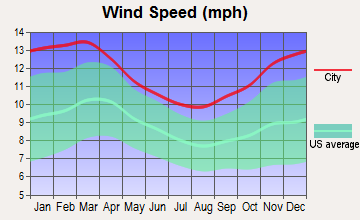
Wind speed - Average
11.6 mph
10.5 mph
Average climate in Queens, New York
Average climate in Staten Island, New York
Air pollution
Type
AQI
CO
NO2
OZONE
PB
PM10
PM25
SO2
Year
Queens
Staten Island
Queens
Staten Island
Queens
Staten Island
Queens
Staten Island
Queens
Staten Island
Queens
Staten Island
Queens
Staten Island
Queens
Staten Island
2018
97
94
0.26
0.35
14.7
17.1
25.4
24.1
N/A
N/A
N/A
N/A
6.4
7.9
0.4
0.4
2017
98
98
0.23
0.32
15.4
17.0
25.8
27.0
N/A
N/A
N/A
N/A
6.4
7.6
0.5
0.2
2016
97
94
0.24
0.37
16.0
17.9
25.5
28.5
N/A
N/A
N/A
N/A
6.7
7.7
0.6
0.2
2015
104
102
0.26
0.39
17.4
18.9
24.1
27.3
N/A
N/A
N/A
N/A
7.9
8.6
0.8
0.4
2014
99
97
0.25
0.38
17.0
19.2
24.3
25.6
N/A
N/A
N/A
N/A
7.8
8.3
1.1
0.7
2013
101
99
0.23
0.39
17.7
19.6
25.8
27.8
N/A
N/A
N/A
N/A
8.7
8.5
1.2
0.8
2012
105
102
0.26
0.42
17.6
19.3
25.8
26.9
N/A
N/A
N/A
N/A
9.1
9.2
1.8
1.4
2011
112
108
0.27
0.42
20.4
21.4
24.2
28.1
N/A
N/A
N/A
N/A
10.6
10.2
2.7
2.0
2010
112
114
0.35
0.40
19.4
19.9
23.6
28.7
N/A
N/A
N/A
N/A
10.3
9.4
2.9
1.8
2009
107
105
0.24
0.39
21.0
22.5
21.0
25.3
N/A
N/A
N/A
N/A
9.7
9.5
3.4
2.4
2008
113
111
0.44
0.39
22.6
23.0
22.0
24.3
0.013
0.013
N/A
N/A
11.0
11.3
4.1
3.4
2007
121
123
0.46
0.44
22.9
24.2
20.2
23.3
0.016
0.016
N/A
N/A
11.6
12.0
4.9
4.3
2006
120
117
0.46
0.55
23.5
25.6
20.3
24.7
0.018
0.018
N/A
N/A
12.7
13.1
5.3
5.3
2005
110
112
0.54
0.69
25.5
27.3
19.7
23.3
N/A
N/A
N/A
N/A
N/A
N/A
6.7
7.3
2004
107
109
0.55
0.68
25.1
26.4
18.2
22.2
0.030
0.030
N/A
N/A
N/A
N/A
5.8
6.9
2003
110
112
0.63
0.76
26.9
28.0
18.9
22.1
0.022
0.006
26.9
26.9
N/A
N/A
7.0
7.1
2002
124
125
0.58
0.74
27.9
30.6
19.2
24.7
0.008
0.008
25.7
26.1
N/A
N/A
6.5
6.6
2001
124
124
0.60
0.81
28.8
32.4
19.3
24.9
0.020
0.020
24.5
26.9
N/A
N/A
7.8
7.2
2000
115
116
0.67
0.93
28.4
33.0
17.6
23.1
0.022
0.022
22.2
22.2
N/A
N/A
7.3
7.2
Natural disasters
Type
Queens
Staten Island
Tornado activity compared to U.S. average
54%
61.3%
Earthquake activity compared to U.S. average
30.6%
31.2%
Natural disasters compared to U.S. average
19%
19%
Transportation
Queens is well-connected with several subway and bus lines. Conversely, Staten Island relies on buses and the Staten Island Ferry for commuting to Manhattan. Owning a car is more feasible in Staten Island due to more parking availability and less traffic compared to Queens.
Transport
Type
Queens
Staten Island
Amtrak stations
2
0
Amtrak stations nearby
3
3
FAA registered aircraft
4
39
FAA registered aircraft manufacturers and dealers
0
2
Means of transportation to work
Type
Queens
Staten Island
Bicycle
0.3%
0.2%
Bus
10%
19.2%
Carpooled
10.2%
12.1%
Car alone
34.3%
54.3%
Ferryboat
0%
5.3%
Railroad
2.2%
0.9%
Streetcar
0.2%
0%
Subway
34.3%
2.6%
Taxicab
0.7%
0.4%
Walked
5.7%
2.9%
Average travel time to work
Type
Queens
Staten Island
Average
44 min
45.3 min
Real Estate
Both boroughs offer diverse housing options, ranging from high-rise apartments to single-family homes. Queens real estate tends to be more expensive due to its vicinity to Manhattan and better public transit. Staten Island offers more affordable housing options, with the potential for larger properties and more green space.
Neighborhoods
Queens is known for its culturally diverse neighborhoods, with Flushing's vibrant Asian community or Astoria's prominent Greek population. Each neighborhood displays unique cultural characteristics via restaurants, shops, and community events. Staten Island, quieter and more suburban, is perfect for those seeking a small-town feeling within the city. Neighborhoods such as St. George and New Dorp present a unique blend of urban and suburban environments.
Houses and residents
Type
Queens
Staten Island
Houses
817,250
163,993
Average household size (people)
2.8
2.8
Houses occupied
782,664 (95.8%)
156,341 (95.3%)
Houses occupied by owners
334,894 (42.8%)
99,732 (63.8%)
Houses occupied by renters
447,770 (57.2%)
56,609 (36.2%)
Median rent asked for vacant for-rent units
$1,666
$1,320
Median price asked for vacant for-sale houses and condos
$615,765
$369,853
Estimated median house or condo value
$642,000
$605,500
Median number of rooms in apartments
3.7
3.9
Median number of rooms in houses and condos
5.4
6.1
Renting percentage
57%
35.9%
Housing density (houses/condos per square mile)
7,481.6
2,804.3
Household income disparities
44.9%
43.8%
Housing units without a mortgage
64,617 (34.6%)
19,289 (25%)
Housing units with both a second mortgage and home equity loan
311 (0.2%)
160 (0.2%)
Housing units with a mortgage
122,366 (65.4%)
57,986 (75%)
Housing units with a home equity loan
9,927 (5.3%)
5,623 (7.3%)
Housing units with a second mortgage
10,707 (5.7%)
4,499 (5.8%)
Housing units lacking complete kitchen facilities
1%
0.6%
Housing units lacking complete plumbing facilities
1.1%
0.5%
Housing units in structures
Housing units in structures
Queens
Staten Island
One, detached
21.1%
33.8%
One, attached
9.8%
24.2%
Two
19.2%
23.0%
3 or 4
10.5%
5.0%
5 to 9
5.6%
2.4%
10 to 19
3.4%
1.6%
20 to 49
9.4%
2.9%
50 or more
20.9%
6.9%
Mobile homes
0.1%
0.2%
Median real estate property taxes paid for housing units
Self-employed workers in own not incorporated business
48,383
7,611
State government workers
21,536
6,285
Unpaid family workers
2,382
394
Industries and Occupations
In Queens, the fastest-growing industries are healthcare, social assistance, and construction. For Staten Island, the dominant industries are healthcare, retail, and education. An increasingly significant number of residents in both boroughs are also working in technology-driven roles.
Both boroughs offer exceptional health care services. Queens is home to some of New York's top-rated hospitals, including Elmhurst Hospital Center and New York-Presbyterian Queens. Staten Island also has quality healthcare facilities, including Richmond University Medical Center and Staten Island University Hospital.
Queens offers extensive commuting options via the subway, buses, and taxis, providing easy access to Manhattan and other boroughs. Staten Island has less robust public transit, relying heavily on its bus system and the Staten Island Ferry. Both boroughs, however, are witnessing continuous infrastructure improvements.
Infrastructure
Type
Queens
Staten Island
Hospitals
1
25
TV stations
30
30
Schools
School facilities
Type
Queens
Staten Island
Private elementary/middle schools
8
22
Private high schools
1
13
Public elementary/middle schools
6
63
Public high schools
2
16
Colleges/Universities
1
5
Culture and Food
Food and culture in Queens is highly diverse, reflectings its mixing of ethnicities. Residents and visitors have endless cuisine options ranging from Latin American to Asian, Middle Eastern, and more. Staten Island also offers a mix of cultures, with Italian influence being predominant. Both boroughs host various cultural festivals and events throughout the year.
Sports Teams
Both boroughs are home to minor league baseball teams - the Staten Island Yankees and the Brooklyn Cyclones (who play in Queens). While Queens is home to two major league teams - the New York Mets (MLB) and the New York City FC (MLS), playing at Citi Field.


 Queens, NY
 Staten Island, NY