San Jose, CA, known for its tech-savvy culture, diverse population, warm climate, and high cost of living, vastly contrasts Atlanta, GA, a city marked by southern hospitality, diverse cultural experiences, and a more affordable cost of living. Whether you're contemplating moving or looking for a tourist destination, both cities have unique offerings.
Distance between
San Jose, CA and
Atlanta, GA : 2,107.1 miles
San Jose's population is larger by 98%. Its population has grown by 88,546 people (9.9%) since 2000. The population of Atlanta has grown by 79,987 people (19.2%) during that time.
In terms of safety, San Jose tends to be safer than Atlanta. According to the FBI crime data, Atlanta has a higher crime rate, especially in property and violent crimes. However, both cities have numerous safe and family-friendly neighborhoods. For tourists, it's always recommended to stay in the well-frequented areas and follow general safety guidelines.
City-data.com crime index counts serious crimes and violent crime more heavily. It adjusts for the number of visitors and daily workers commuting into cities. (higher means more crime, U.S. average = 301.1)
City-data.com crime index counts serious crimes and violent crime more heavily. It adjusts for the number of visitors and daily workers commuting into cities. (higher means more crime, U.S. average = 301.1)
Sex Offenders
According to our data, there are 1,806 registered sex offenders living in San Jose and 1,961 registered sex offenders living in . The ratio of residents to sex offenders in San Jose is 568 to 1; the ratio in Atlanta is 241 to 1. The number of registered sex offenders compared to the number of residents is a smaller in San Jose than in Atlanta.
Cost of Living
The cost of living in San Jose is significantly higher than in Atlanta, primarily due to housing costs. San Jose, being the heart of Silicon Valley, has sky-high rents and home prices. In comparison, Atlanta offers a much more affordable living, including lower costs for groceries, healthcare, and utilities.
Income Tax
California has a high income tax system with progressive rates reaching 13.3%, affecting high-earning San Jose residents. Georgia has a lower tax burden with income tax rates ranging from 1% to 5.75%.
Property Tax
San Jose's property taxes are lower than the national average (around 0.8%). In contrast, property taxes in Atlanta are higher, with rates between 0.9% and 1.2%.
Sales Tax
San Jose has a high sales tax at 9.25%, while Atlanta's sales tax is lower at 8.9%. However, both are higher than the national average.
Income
Type
San Jose
Atlanta
Estimated median household income
$126,377
$74,107
Estimated per capita income
$57,357
$55,051
Cost of living index (U.S. average is 100)
127.4
104.3
If you make $50,000 in Atlanta, you will have to make $61,074 in San Jose to maintain the same standard of living.
Geographical Conditions
San Jose is flanked by mountains and enjoys a serene environment enriched by hiking trails and parks. Atlanta, known as the "City in a Forest," is identified by its lush canopy, numerous parks and gardens.
Both cities boast of excellent education systems. San Jose is home to top universities like Stanford University and Santa Clara University and has a high graduation rate. Atlanta is also rich in educational opportunities with prestigious institutions like Emory University and Georgia Tech. Their public schools offer diverse education programs, catering to the various needs of students.
San Jose sits in the heart of Silicon Valley and has a thriving economy dominated by the tech industry with companies like Apple, Google, and Facebook. Atlanta has a diverse economy encompassing logistics, professional and business services, media operations, and information technology. Both cities offer robust job markets.
Biggest Employers
San Jose's biggest employers are primarily technology companies, including Apple, Google, and Cisco Systems. In Atlanta, the largest employers are The Home Depot, Delta Airlines, and the Centers for Disease Control and Prevention (CDC).
There were 299 building permits issued in San Jose in 2012 (216 more than in 2011) compared to 855 building permits issued in Atlanta in 2012 (628 more than in 2011).
In San Jose (Santa Clara County), 70.0% voted for Democrats and 27.1% for Republicans in 2012 Presidential Election. In Atlanta (Fulton County), 64.3% voted for Democrats and 34.5% for Republicans.
Elections
Type
Democrats
Republicans
Other
Year
San Jose
Atlanta
San Jose
Atlanta
San Jose
Atlanta
2020
72.7%
72.6%
25.2%
26.2%
2.1%
1.2%
2016
72.7%
67.8%
20.6%
26.9%
6.7%
5.3%
2012
70.0%
64.3%
27.1%
34.5%
2.9%
1.2%
2008
69.6%
67.2%
28.6%
32.2%
1.8%
0.6%
2004
64.3%
59.4%
34.8%
40.0%
0.9%
0.7%
2000
60.7%
57.9%
34.4%
39.9%
4.9%
2.2%
1996
56.9%
58.9%
32.2%
36.9%
11.0%
4.1%
Breakdown of population affiliated with a religious congregation
Type
Adherents
Congregations
Religion
San Jose
Atlanta
San Jose
Atlanta
CATHOLIC CHURCH
25.1%
9.9%
6.0%
2.4%
MUSLIM ESTIMATE
1.1%
1.4%
1.8%
1.7%
SOUTHERN BAPTIST CONVENTION
0.9%
7.9%
7.7%
14.7%
EPISCOPAL CHURCH
0.5%
2.1%
2.3%
2.1%
SEVENTH DAY ADVENTIST CHURCH
0.4%
1.2%
2.6%
1.5%
EVANGELICAL LUTHERAN CHURCH IN AMERICA
0.3%
0.6%
2.3%
1.5%
AMERICAN BAPTIST CHURCHES IN THE USA
0.1%
0.8%
1.1%
1.1%
Weather
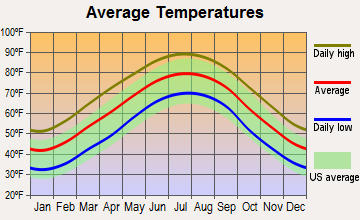
San Jose experiences a warm Mediterranean climate with over 300 days of sunshine every year, making it popular for outdoor activities. Atlanta, on the other hand, experiences a humid subtropical climate with hot, wet summers and cool, mild winters. Despite this, Atlanta’s lush green spaces are a major attraction.
Weather and climate
Type
San Jose
Atlanta
Temperature - Average
60.9°F
61.7°F
Humidity - Average morning or afternoon humidity
77.3%
73.9%
Humidity - Differences between morning and afternoon humidity
35.5%
38%
Humidity - Maximum monthly morning or afternoon humidity
87%
87%
Humidity - Minimum monthly morning or afternoon humidity
51.6%
49%
Precipitation - Yearly average
16.1 in
51.4 in
Snowfall - Yearly average
0 in
4 in
Clouds - Number of days clear of clouds
27.4%
18.3%
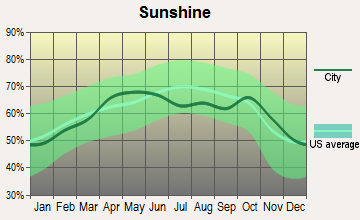
Sunshine amount - Average
73.8%
65.6%
Sunshine amount - Differences during a year
23%
17%
Sunshine amount - Maximum monthly
77.4%
67%
Sunshine amount - Minimum monthly
54.4%
50%
Wind speed - Average
10.3 mph
9 mph
Average climate in San Jose, California
Average climate in Atlanta, Georgia
Air pollution
Type
AQI
CO
NO2
OZONE
PB
PM10
PM25
SO2
Year
San Jose
Atlanta
San Jose
Atlanta
San Jose
Atlanta
San Jose
Atlanta
San Jose
Atlanta
Atlanta
San Jose
Atlanta
San Jose
Atlanta
2018
94
84
0.49
0.27
14.5
N/A
22.2
24.7
0.006
N/A
17.5
N/A
12.5
10.6
0.2
0.8
2017
91
87
0.50
0.31
14.6
N/A
23.5
24.7
0.004
N/A
17.5
N/A
10.2
11.3
0.2
1.2
2016
69
105
0.47
0.31
13.7
N/A
22.4
25.9
0.003
N/A
17.2
N/A
8.8
11.1
0.2
1.0
2015
84
91
0.52
0.31
15.4
N/A
22.3
23.9
0.004
N/A
17.6
N/A
9.2
10.2
0.3
0.9
2014
83
88
0.40
0.31
13.9
N/A
21.5
24.0
0.004
N/A
18.4
N/A
8.2
9.1
0.2
1.1
2013
90
88
0.41
0.30
15.2
N/A
20.8
23.7
0.005
N/A
18.0
N/A
12.4
8.7
0.3
1.0
2012
74
109
0.35
0.33
13.3
N/A
21.8
26.2
0.003
N/A
19.5
N/A
10.1
9.8
0.3
1.1
2011
83
98
0.37
0.33
14.8
N/A
20.6
27.5
0.003
N/A
21.2
N/A
12.3
12.0
0.3
1.7
2010
88
102
0.35
0.35
14.4
N/A
20.4
25.8
0.004
N/A
18.5
N/A
9.0
12.5
0.4
1.9
2009
89
96
0.40
N/A
14.7
N/A
18.2
25.2
0.004
N/A
18.5
N/A
9.3
13.8
0.3
1.7
2008
100
99
0.45
0.53
16.7
15.3
20.6
31.2
N/A
0.003
22.5
N/A
12.6
16.3
N/A
2.5
2007
92
124
0.44
0.45
16.6
17.0
20.0
33.1
0.009
0.003
29.4
N/A
11.1
18.1
N/A
2.7
2006
100
129
0.46
0.58
18.0
17.9
21.8
31.3
N/A
0.003
22.9
N/A
11.1
19.7
N/A
3.4
2005
95
123
0.68
0.55
18.6
17.2
20.0
29.0
N/A
0.005
25.5
N/A
11.6
15.8
N/A
3.2
2004
98
118
0.63
0.54
18.5
16.9
20.4
28.8
N/A
0.004
22.9
N/A
9.9
14.6
N/A
2.8
2003
87
112
0.73
0.56
20.6
16.4
19.1
26.7
N/A
0.004
22.2
N/A
N/A
15.4
N/A
3.0
2002
78
120
0.65
0.60
19.5
19.4
18.0
27.9
0.006
N/A
23.2
N/A
N/A
13.1
N/A
3.0
2001
75
117
0.61
0.69
18.5
23.3
16.8
27.2
0.008
N/A
27.0
N/A
N/A
N/A
N/A
3.1
2000
65
132
0.66
0.50
18.9
22.9
15.6
31.2
0.009
N/A
28.4
N/A
N/A
N/A
N/A
3.2
Natural disasters
Type
San Jose
Atlanta
Tornado activity compared to U.S. average
9%
159.5%
Earthquake activity compared to U.S. average
7,785.3%
153.4%
Natural disasters compared to U.S. average
19%
15%
Transportation
Both cities have well-structured public transportation. San Jose offers light rail, buses, and the BART system, and Atlanta provides MARTA rail system and bus services. Although both have heavy traffic, Atlanta ranks slightly better for commuting times.
Transport
Type
San Jose
Atlanta
Amtrak stations
1
1
Amtrak stations nearby
3
1
FAA registered aircraft
553
1
FAA registered aircraft manufacturers and dealers
13
28
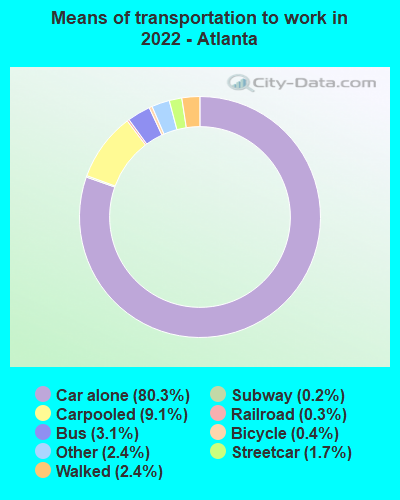
Means of transportation to work
Type
San Jose
Atlanta
Bicycle
1%
0.5%
Bus
1.1%
2.1%
Carpooled
11.4%
7.6%
Car alone
80.5%
84%
Motorcycle
0.2%
0.1%
Railroad
0.2%
0.2%
Streetcar
0%
1.1%
Subway
0.2%
0.4%
Taxicab
0%
0.3%
Walked
3.3%
1.9%
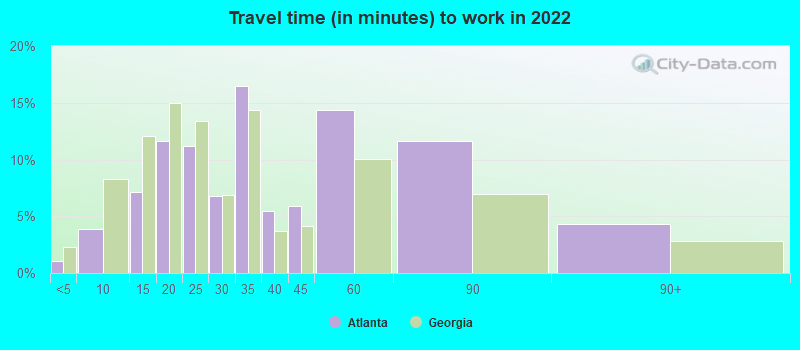
Average travel time to work
Type
San Jose
Atlanta
Average
29.2 min
34.9 min
Other means
27.9 min
24.4 min
Public transportation
48.5 min
47.8 min
Private vehicle occupancy
Type
San Jose
Atlanta
Average
1.2
1.1
Drove alone
87.3%
92.5%
In 2 person carpool
8.9%
6.7%
In 3 person carpool
1.9%
0.6%
In 4 person carpool
1.1%
0.3%
In 5-6 person carpool
0.6%
0%
In 7+ person carpool
0.2%
0%
How many people usually rode to work in the car, truck or van.
Real Estate
San Jose's real estate is one of the most expensive in the US, with home prices well above the national average. On the other hand, Atlanta has a more affordable housing market, offering a mix of urban apartments and suburban homes.
Neighborhoods
San Jose's vibrant neighborhoods like Willow Glen, Silver Creek, and Almaden Valley offer suburban feels with urban amenities. In Atlanta, areas like Buckhead, Midtown, and Virginia Highland are popular for their historic charm, dining, and cultural experiences.
Houses and residents
Type
San Jose
Atlanta
Houses
340,561
253,355
Average household size (people)
3.1
2.1
Median year apartment built
1979
1996
Median year house/condo built
1973
1976
Length of stay in the house since moving in
15.6 years
12.2 years
Houses occupied
322,881 (94.8%)
232,720 (91.9%)
Houses occupied by owners
179,797 (55.7%)
113,092 (48.6%)
Houses occupied by renters
143,084 (44.3%)
119,628 (51.4%)
Median rent asked for vacant for-rent units
$3,214
$1,226
Median monthly housing costs
$2,463
$1,504
Median price asked for vacant for-sale houses and condos
$1,197,016
$325,147
Estimated median house or condo value
Over $1,000,000
$375,500
Median numbers of rooms
4.9
4.5
Median number of rooms in apartments
3.6
3.5
Median number of rooms in houses and condos
6
6.2
Median house price - detached houses
Over $1,000,000
$585,854
Median house price - in 2-unit structures
$753,788
$359,451
Median house price - in 3-to-4-unit structures
$680,453
$453,504
Median house price - in 5 or more unit structures
$688,625
$356,868
Median house price - mobile homes
$240,963
$149,278
Median house price - Townhouses or other attached units
$892,629
$383,334
Median house price - All housing units
Over $1,000,000
$508,525
Median house age
45
34
Renting percentage
41.5%
55.1%
Housing density (houses/condos per square mile)
1,947.6
1,923
House value disparities
21.2%
36.3%
Household income disparities
38.3%
47.8%
Median household income for houses/condes with a mortgage
$197,583
$123,344
Median household income for apartments without a mortgage
$103,711
$75,939
Housing units without a mortgage
2,632 (2.1%)
1,022 (1.3%)
Housing units with both a second mortgage and home equity loan
13,499 (10.6%)
5,566 (7%)
Housing units with a mortgage
124,224 (97.9%)
78,250 (98.7%)
Housing units with a home equity loan
346 (0.3%)
58 (0.1%)
Housing units with a second mortgage
16,249 (12.8%)
7,203 (9.1%)
House/condo owner moved in on average (years ago)
14
7
House/condo renter moved in on average (years ago)
3
1
Housing units lacking complete kitchen facilities
1.2%
2%
Housing units lacking complete plumbing facilities
0.6%
1.5%
Housing units in structures
Housing units in structures
San Jose
Atlanta
One, detached
50.9%
37.5%
One, attached
11.5%
6.6%
Two
1.1%
2.4%
3 or 4
5.0%
3.9%
5 to 9
5.1%
5.9%
10 to 19
4.5%
5.7%
20 to 49
4.5%
6.8%
50 or more
14.2%
30.7%
Mobile homes
3.1%
0.5%
Boats, RVs, vans, etc.
0.1%
0.0%
Median real estate property taxes paid for housing units
Self-employed workers in own not incorporated business
28,517
15,892
State government workers
10,222
13,288
Unpaid family workers
472
550
Industries and Occupations
In San Jose, the primary industries are technology, software services, and digital marketing. Conversely, Atlanta's economy is diversified, including sectors such as logistics, media, healthcare, and IT. Both cities offer a wide range of job opportunities, depending on the skills and qualifications.
Both cities offer excellent healthcare with world-class hospitals. San Jose is renowned for facilities like Stanford Health Care and Kaiser Permanente. In Atlanta, the healthcare system is anchored by institutions like Emory Healthcare and Atlanta Medical Center.
Health (county statistics)
Type
San Jose
Atlanta
General health status score of residents in this county from 1 (poor) to 5 (excellent)
San Jose has developed infrastructure, marked by high-rise buildings, tech campuses, and an efficient mass transit system. Conversely, Atlanta mixes modern and historic architecture, with strong road networks, mass transit systems, and the busiest airport in the world, Hartsfield-Jackson Atlanta International Airport.
Infrastructure
Type
San Jose
Atlanta
Hospitals
20
46
TV stations
9
22
Arenas or stadiums
2
6
Bank branches located here
145
235
Bank institutions located here
25
41
Main business address for public companies
74
85
Drinking water stations with no reported violations in the past
21
5
Drinking water stations with reported violations in the past
HMDA - Conventional home purchase loans - Applications denied
Year
San Jose
Atlanta
1999
3,839
1,775
2000
2,577
1,902
2001
1,953
1,552
2002
1,908
1,683
2003
3,578
3,212
2004
5,489
4,962
2005
6,994
9,078
2006
6,324
10,866
2007
4,298
6,626
2008
2,419
2,140
2009
1,631
731
Culture and Food
San Jose offers diverse culture and cuisine owing to its multicultural population, and its tech-oriented culture is legendary. Conversely, Atlanta offers rich southern culture and cuisine, including popular dishes like fried chicken, cornbread, and peach cobbler.
Sports Teams
Both cities are home to major sports teams. San Jose has the San Jose Sharks (NHL), Earthquakes (MLS), and Silicon Valley Sevens (Rugby). Atlanta is abundant in sports, housing teams like the Atlanta Braves (MLB), Falcons (NFL), and Hawks (NBA).


 San Jose, CA
 Atlanta, GA