San Jose, California, and Chesapeake, Virginia, offer diverse living experiences in the US west coast and east coast respectively. These cities both have unique offerings in various sectors such as safety, weather conditions, costs of living, education, work and economy, culture, and sports among others. This overview provides detailed comparisons to assist in understanding the distinctive lifestyle and opportunities in each city for both those considering relocation and tourists visiting these charming cities.
Distance between
San Jose, CA and
Chesapeake, VA : 2,489.4 miles
San Jose's population is larger by 291%. Its population has grown by 88,546 people (9.9%) since 2000. The population of Chesapeake has grown by 52,085 people (26.1%) during that time.
San Jose is one of the safest large cities in the U.S., with relatively low crime rates compared to the national average. Although crime exists as in any city, the robust police force is well-funded and effective in maintaining law and order. Chesapeake, too, is considered safe with crime rates lower than state average. Both cities have proactive law enforcement agencies, making both places safe to live and visit.
City-data.com crime index counts serious crimes and violent crime more heavily. It adjusts for the number of visitors and daily workers commuting into cities. (higher means more crime, U.S. average = 301.1)
City-data.com crime index counts serious crimes and violent crime more heavily. It adjusts for the number of visitors and daily workers commuting into cities. (higher means more crime, U.S. average = 301.1)
Sex Offenders
According to our data, there are 1,806 registered sex offenders living in San Jose and 498 registered sex offenders living in . The ratio of residents to sex offenders in San Jose is 568 to 1; the ratio in Chesapeake is 474 to 1. The number of registered sex offenders compared to the number of residents in San Jose is near to than in Chesapeake.
Cost of Living
The cost of living in San Jose, CA, is significantly higher than the national average and that of Chesapeake, VA. This is mainly due to San Jose's higher housing costs and overall living expenses. On the other hand, Chesapeake's cost of living is close to the national average, making it a more affordable place to live or visit.
Income Tax
California's income tax rate is progressive and ranges from 1% to 13.3%, depending on income. Virginia's income tax is also progressive, but the top rate is significantly lower at only 5.75%. Residents of Chesapeake would therefore enjoy lower state income tax rates than those in San Jose.
Property Tax
Though California has higher overall tax rates, it's important to note that its property tax rates are relatively low, with San Jose having an average rate of 0.77%. In contrast, Virginia has slightly higher property tax rates, with Chesapeake's averaging around 0.90%.
Sales Tax
California, where San Jose is located, has a base sales tax rate of 7.25%, one of the highest in the country. Virginia has a lower sales tax rate at 5.3%, making Chesapeake a relatively cheaper city for shopping and commerce.
Income
Type
San Jose
Chesapeake
Estimated median household income
$126,377
$88,815
Estimated per capita income
$57,357
$39,875
Cost of living index (U.S. average is 100)
127.4
96.1
If you make $50,000 in Chesapeake, you will have to make $66,285 in San Jose to maintain the same standard of living.
Geographical Conditions
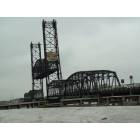
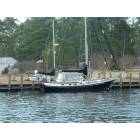
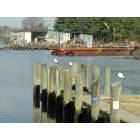
San Jose, nestled within the Santa Clara Valley and surrounded by rolling hills, offers a diverse landscape admired by many. Chesapeake, located in the coastal plains, features plenty of waterways and lush green landscapes and is known for being a part of the Great Dismal Swamp.
San Jose is home to several high-ranking universities like San Jose State University and prestigious institutions in nearby areas like Stanford University, making the city's education standards high. Chesapeake also offers good-quality education with the city boasting of top-notch schools and nearby universities such as Norfolk State University and Old Dominion University.
San Jose, being the de-facto capital of Silicon Valley, offers numerous job opportunities in the tech industry. High salaries and rapid innovation contribute to its robust economy. Chesapeake has a diverse economy with job opportunities spread across sectors like defense, government services, health care, and retail trade.
Biggest Employers
San Jose's biggest employers are high-tech companies like Cisco Systems, eBay, and Adobe Systems, with healthcare providers also contributing to employment. Chesapeake houses the headquarters of Dollar Tree and has major employers including Chesapeake Regional Healthcare and the city's school system.
There were 299 building permits issued in San Jose in 2012 (216 more than in 2011) compared to 942 building permits issued in Chesapeake in 2012 (289 more than in 2011).
In San Jose (Santa Clara County), 70.0% voted for Democrats and 27.1% for Republicans in 2012 Presidential Election. In Chesapeake (Chesapeake city), 50.1% voted for Democrats and 49.1% for Republicans.
Elections
Type
Democrats
Republicans
Other
Year
San Jose
Chesapeake
San Jose
Chesapeake
San Jose
Chesapeake
2020
72.7%
52.2%
25.2%
45.8%
2.1%
2.0%
2016
72.7%
46.7%
20.6%
48.0%
6.7%
5.3%
2012
70.0%
50.1%
27.1%
49.1%
2.9%
0.8%
2008
69.6%
50.5%
28.6%
49.2%
1.8%
0.3%
2004
64.3%
42.4%
34.8%
57.3%
0.9%
0.3%
2000
60.7%
45.2%
34.4%
53.4%
4.9%
1.4%
1996
56.9%
45.8%
32.2%
46.7%
11.0%
7.5%
Breakdown of population affiliated with a religious congregation
Type
Adherents
Congregations
Religion
San Jose
Chesapeake
San Jose
Chesapeake
CATHOLIC CHURCH
25.1%
5.9%
6.0%
2.5%
MUSLIM ESTIMATE
1.1%
1.5%
1.8%
0.5%
SOUTHERN BAPTIST CONVENTION
0.9%
10.7%
7.7%
19.1%
EPISCOPAL CHURCH
0.5%
0.4%
2.3%
1.0%
SEVENTH DAY ADVENTIST CHURCH
0.4%
0.2%
2.6%
2.5%
EVANGELICAL LUTHERAN CHURCH IN AMERICA
0.3%
0.1%
2.3%
0.5%
Weather
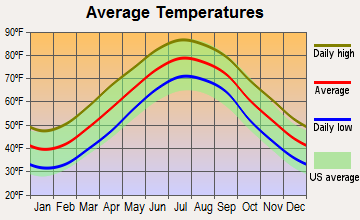
San Jose features a Mediterranean climate with warm, dry summers and mild, wet winters. Many visitors and potential residents find this weather pattern appealing, offering year-round outdoor opportunities. Chesapeake, on the other hand, experiences a humid subtropical climate with hot, humid summers and mild to cool winters. Chesapeake's weather can occasionally be unpredictable, with potential for snow in winter and hurricanes in summer.
Weather and climate
Type
San Jose
Chesapeake
Temperature - Average
60.9°F
59.5°F
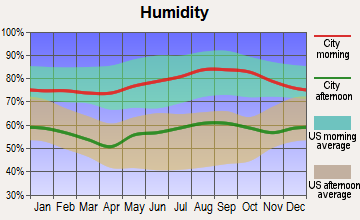
Humidity - Average morning or afternoon humidity
77.3%
73%
Humidity - Differences between morning and afternoon humidity
35.5%
32%
Humidity - Maximum monthly morning or afternoon humidity
87%
83%
Humidity - Minimum monthly morning or afternoon humidity
51.6%
51%
Precipitation - Yearly average
16.1 in
48.1 in
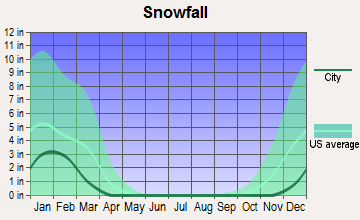
Snowfall - Yearly average
0 in
15.4 in
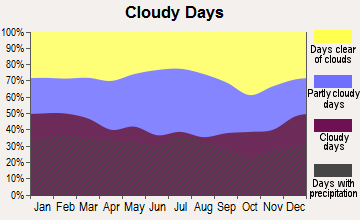
Clouds - Number of days clear of clouds
27.4%
17.6%
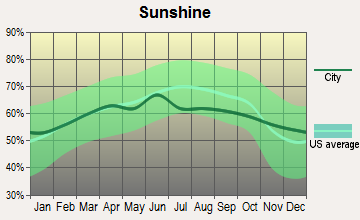
Sunshine amount - Average
73.8%
66.8%
Sunshine amount - Differences during a year
23%
14%
Sunshine amount - Maximum monthly
77.4%
67%
Sunshine amount - Minimum monthly
54.4%
53%
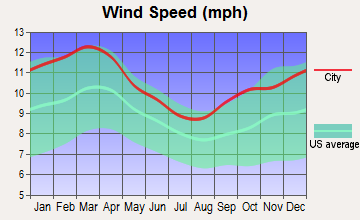
Wind speed - Average
10.3 mph
10.4 mph
Average climate in San Jose, California
Average climate in Chesapeake, Virginia
Air pollution
Type
AQI
CO
NO2
OZONE
PB
PM25
SO2
Year
San Jose
Chesapeake
San Jose
Chesapeake
San Jose
Chesapeake
San Jose
Chesapeake
San Jose
Chesapeake
San Jose
Chesapeake
San Jose
Chesapeake
2018
94
57
0.49
0.29
14.5
6.7
22.2
30.8
0.006
0.002
12.5
6.1
0.2
0.3
2017
91
60
0.50
0.23
14.6
7.3
23.5
32.9
0.004
0.002
10.2
6.9
0.2
0.3
2016
69
66
0.47
0.22
13.7
7.0
22.4
31.3
0.003
0.002
8.8
6.1
0.2
0.3
2015
84
57
0.52
0.27
15.4
7.8
22.3
33.4
0.004
0.002
9.2
6.4
0.3
0.5
2014
83
59
0.40
0.28
13.9
8.0
21.5
33.4
0.004
0.002
8.2
6.8
0.2
1.2
2013
90
66
0.41
0.28
15.2
7.5
20.8
30.8
0.005
0.002
12.4
6.8
0.3
1.2
2012
74
76
0.35
0.29
13.3
8.2
21.8
34.1
0.003
0.002
10.1
8.1
0.3
1.1
2011
83
66
0.37
0.27
14.8
9.9
20.6
34.7
0.003
0.003
12.3
8.8
0.3
1.7
2010
88
71
0.35
0.24
14.4
4.8
20.4
38.1
0.004
0.004
9.0
N/A
0.4
2.2
2009
89
51
0.40
0.25
14.7
9.7
18.2
31.5
0.004
0.012
9.3
N/A
0.3
2.7
2008
100
77
0.45
0.24
16.7
10.3
20.6
36.2
N/A
0.004
12.6
N/A
N/A
3.4
2007
92
81
0.44
0.17
16.6
12.2
20.0
36.6
0.009
0.004
11.1
N/A
N/A
4.5
2006
100
62
0.46
0.33
18.0
N/A
21.8
36.8
N/A
0.004
11.1
N/A
N/A
3.4
2005
95
67
0.68
0.28
18.6
N/A
20.0
35.7
N/A
N/A
11.6
N/A
N/A
3.4
2004
98
80
0.63
0.29
18.5
15.9
20.4
33.6
N/A
N/A
9.9
N/A
N/A
4.3
2003
87
84
0.73
0.34
20.6
16.2
19.1
34.6
N/A
N/A
N/A
N/A
N/A
4.0
2002
78
99
0.65
0.40
19.5
17.8
18.0
38.2
0.006
N/A
N/A
N/A
N/A
6.1
2001
75
92
0.61
0.42
18.5
18.2
16.8
36.6
0.008
N/A
N/A
N/A
N/A
6.1
2000
65
85
0.66
0.44
18.9
15.7
15.6
36.9
0.009
N/A
N/A
N/A
N/A
6.6
Natural disasters
Type
San Jose
Chesapeake
Tornado activity compared to U.S. average
9%
72.4%
Earthquake activity compared to U.S. average
7,785.3%
36.3%
Natural disasters compared to U.S. average
19%
0%
Transportation
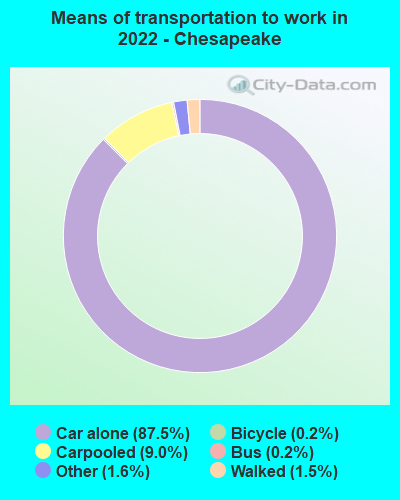
San Jose is home to an extensive public transportation network that includes buses, light rail, and free downtown shuttles. The city also offers convenient access to major highways and aviation via the San Jose International Airport. Chesapeake, known for significant road infrastructure, relies heavily on cars for commuting. Public transportation is limited but growing.
Transport
Type
San Jose
Chesapeake
Amtrak stations
1
0
Amtrak stations nearby
3
3
FAA registered aircraft
553
168
FAA registered aircraft manufacturers and dealers
13
3
Means of transportation to work
Type
San Jose
Chesapeake
Bicycle
1%
0.1%
Bus
1.1%
0.3%
Carpooled
11.4%
9.9%
Car alone
80.5%
86.3%
Motorcycle
0.2%
0.1%
Railroad
0.2%
0%
Subway
0.2%
0%
Walked
3.3%
2.5%
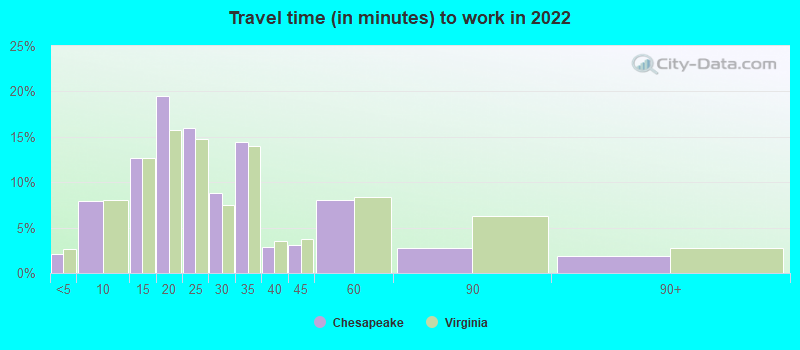
Average travel time to work
Type
San Jose
Chesapeake
Average
29.2 min
24.7 min
Other means
27.9 min
24.8 min
Public transportation
48.5 min
42 min
Private vehicle occupancy
Type
San Jose
Chesapeake
Average
1.2
1.1
Drove alone
87.3%
90.8%
In 2 person carpool
8.9%
7.5%
In 3 person carpool
1.9%
1.2%
In 4 person carpool
1.1%
0.4%
In 5-6 person carpool
0.6%
0.1%
In 7+ person carpool
0.2%
0.1%
How many people usually rode to work in the car, truck or van.
Real Estate
Real estate in San Jose is expensive due to the high demand and limited supply, with median home prices considerably above the national average. Contrastingly, Chesapeake's real estate is more affordable, with home prices near the national average, offering more reasonable options for homebuyers and renters alike.
Neighborhoods
San Jose offers a mix of urban and suburban neighborhoods each with its own unique charm. Notable neighborhoods include Willow Glen, the Rose Garden, and Santana Row. Chesapeake, with its smaller population, presents a range of predominantly suburban neighborhoods like Greenbrier West, Great Bridge, and South Norfolk, each offering a distinctive Virginia charm.
Houses and residents
Type
San Jose
Chesapeake
Houses
340,561
96,040
Average household size (people)
3.1
2.8
Median year apartment built
1979
1985
Median year house/condo built
1973
1990
Length of stay in the house since moving in
15.6 years
12.2 years
Houses occupied
322,881 (94.8%)
93,849 (97.7%)
Houses occupied by owners
179,797 (55.7%)
69,186 (73.7%)
Houses occupied by renters
143,084 (44.3%)
24,663 (26.3%)
Median rent asked for vacant for-rent units
$3,214
$1,502
Median monthly housing costs
$2,463
$1,483
Median price asked for vacant for-sale houses and condos
$1,197,016
$319,618
Estimated median house or condo value
Over $1,000,000
$320,600
Median numbers of rooms
4.9
6.7
Median number of rooms in apartments
3.6
4.4
Median number of rooms in houses and condos
6
7.5
Median house price - detached houses
Over $1,000,000
$345,910
Median house price - in 2-unit structures
$753,788
$123,576
Median house price - in 3-to-4-unit structures
$680,453
$136,311
Median house price - in 5 or more unit structures
$688,625
$134,590
Median house price - mobile homes
$240,963
$35,812
Median house price - Townhouses or other attached units
$892,629
$274,340
Median house price - All housing units
Over $1,000,000
$330,444
Median house age
45
33
Renting percentage
41.5%
27%
Housing density (houses/condos per square mile)
1,947.6
281.9
House value disparities
21.2%
27.1%
Household income disparities
38.3%
41%
Median household income for houses/condes with a mortgage
$197,583
$115,958
Median household income for apartments without a mortgage
$103,711
$71,224
Housing units without a mortgage
2,632 (2.1%)
1,697 (3.1%)
Housing units with both a second mortgage and home equity loan
13,499 (10.6%)
4,439 (8.2%)
Housing units with a mortgage
124,224 (97.9%)
52,330 (96.9%)
Housing units with a home equity loan
346 (0.3%)
61 (0.1%)
Housing units with a second mortgage
16,249 (12.8%)
5,413 (10%)
House/condo owner moved in on average (years ago)
14
9
House/condo renter moved in on average (years ago)
3
1
Housing units lacking complete kitchen facilities
1.2%
1.2%
Housing units in structures
Housing units in structures
San Jose
Chesapeake
One, detached
50.9%
69.6%
One, attached
11.5%
10.4%
Two
1.1%
2.3%
3 or 4
5.0%
2.9%
5 to 9
5.1%
4.6%
10 to 19
4.5%
3.6%
20 to 49
4.5%
2.5%
50 or more
14.2%
2.7%
Mobile homes
3.1%
1.4%
Boats, RVs, vans, etc.
0.1%
0.0%
Median real estate property taxes paid for housing units
Self-employed workers in own not incorporated business
28,517
5,430
State government workers
10,222
3,079
Unpaid family workers
472
728
Industries and Occupations
In San Jose, the dominant industry is tech given its position as the heart of Silicon Valley. Highly-skilled tech occupations are common. In Chesapeake, however, the largest industries are health care, retail trade, and manufacturing.
The health care system in San Jose is exceptional with accessible, top-rated hospitals like the Good Samaritan and the Regional Medical Center. Chesapeake also boasts of quality healthcare system with highly rated hospitals like the Chesapeake Regional Medical Center.
Health (county statistics)
Type
San Jose
Chesapeake
General health status score of residents in this county from 1 (poor) to 5 (excellent)
Both San Jose and Chesapeake enjoy well-paced infrastructure. San Jose, with its numerous tech companies, has a robust digital infrastructure, in addition to well-maintained roads and public buildings. Chesapeake offers excellent infrastructural amenities too with well-maintained roads, bridges, and public utilities.
Infrastructure
Type
San Jose
Chesapeake
Hospitals
20
5
TV stations
9
25
Bank branches located here
145
50
Bank institutions located here
25
15
Main business address for public companies
74
2
Drinking water stations with no reported violations in the past
21
3
Drinking water stations with reported violations in the past
HMDA - Conventional home purchase loans - Applications denied
Year
San Jose
Chesapeake
1999
3,839
0
2000
2,577
0
2001
1,953
0
2002
1,908
0
2003
3,578
461
2004
5,489
749
2005
6,994
820
2006
6,324
834
2007
4,298
561
2008
2,419
171
2009
1,631
75
Culture and Food
San Jose offers a vibrant multicultural experience with numerous events, festivals, and culinary delights reflecting its diversity. The city is famous for its multi-ethnic cuisine. Chesapeake, on the other hand, offers a blend of southern culture, history, and traditional comfort food. Seafood, especially, is a must-try in Chesapeake.
Sports Teams
San Jose, home to the San Jose Sharks (NHL), and the Earthquakes (MLS), offers its residents a frenzy of sports events to attend. Chesapeake, though doesn't have its own professional team, it is within close proximity to cities with NFL, NBA, and minor league baseball teams.


 San Jose, CA
 Chesapeake, VA