San Jose, California and Garland, Texas are cities with their distinct characteristics and attractions. While San Jose, known as the capital of Silicon Valley, offers a bustling, high-tech lifestyle, Garland presents a more laid-back, suburban atmosphere. The difference in cost of living, education, and industries make these two cities unique, and their distinctive culture and sports scenes liven up the residential experience. Choosing between the two mainly depends on personal preferences, living standards, and career demands.
Distance between
San Jose, CA and
Garland, TX : 1,453.8 miles
San Jose's population is larger by 306%. Its population has grown by 88,546 people (9.9%) since 2000. The population of Garland has grown by 26,267 people (12.2%) during that time.
San Jose enjoys a lower crime rate than Garland. According to NeighborhoodScout, San Jose’s crime index is 32 (100 being the safest), so it's safer than 32 percent of U.S. cities. Garland has a crime index of 25, indicating that it is safer than 25 percent of the other U.S. cities. Both cities actively work on reducing crime rates to ensure the safety of residents and visitors.
City-data.com crime index counts serious crimes and violent crime more heavily. It adjusts for the number of visitors and daily workers commuting into cities. (higher means more crime, U.S. average = 301.1)
City-data.com crime index counts serious crimes and violent crime more heavily. It adjusts for the number of visitors and daily workers commuting into cities. (higher means more crime, U.S. average = 301.1)
Sex Offenders
According to our data, there are 1,806 registered sex offenders living in San Jose and 392 registered sex offenders living in . The ratio of residents to sex offenders in San Jose is 568 to 1; the ratio in Garland is 598 to 1. The number of registered sex offenders compared to the number of residents in San Jose is near to than in Garland.
Cost of Living
Living in San Jose is significantly costlier due to the high reality costs driven by the tech boom. On the contrary, Garland, with its low cost of living, is an attractive destination for those seeking a more affordable alternative.
Income Tax
While residents in San Jose have to account for California's progressive income tax, Texas, where Garland is located, does not have a state income tax making it beneficial for higher earners.
Property Tax
Property taxes are slightly higher in Garland compared to San Jose when considering the tax as a percentage of property value. This could be due to Texas not having a state income tax, therefore relying more heavily on property tax revenue.
Sales Tax
San Jose has a high total sales tax rate at 9.25%, due to California's high statewide sales tax. On the other hand, Garland, in Texas, has a slightly lower total sales tax rate of 8.25%.
Income
Type
San Jose
Garland
Estimated median household income
$126,377
$61,607
Estimated per capita income
$57,357
$24,936
Cost of living index (U.S. average is 100)
127.4
95.5
If you make $50,000 in Garland, you will have to make $66,702 in San Jose to maintain the same standard of living.
Geographical Conditions
Garland lies within the Blackland Prairies, and the Duck Creek runs through it. Conversely, San Jose, situated in the Santa Clara Valley, offers a wide range of recreational activities due to its proximity to beaches and mountains.
Garland Independent School District serves Garland, offering an array of public and private education opportunities. San Jose stands out in this area because of the presence of top-tier schools and universities, including the prestigious Stanford University and San Jose State University.
San Jose's economy is heavily influenced by the tech industry, hosting headquarters like Google and Apple. Garland's economy is diversified, encompassing industries such as electronics, dairy, and telecommunications.
Biggest Employers
San Jose's top employers are tech giants like Cisco Systems and eBay. Garland has various large employers across sectors like the Garland Independent School District and Kraft Foods.
There were 299 building permits issued in San Jose in 2012 (216 more than in 2011) compared to 427 building permits issued in Garland in 2012 (279 more than in 2011).
In San Jose (Santa Clara County), 70.0% voted for Democrats and 27.1% for Republicans in 2012 Presidential Election. In Garland (Dallas County), 57.3% voted for Democrats and 41.8% for Republicans.
Elections
Type
Democrats
Republicans
Other
Year
San Jose
Garland
San Jose
Garland
San Jose
Garland
2020
72.7%
65.1%
25.2%
33.4%
2.1%
1.4%
2016
72.7%
60.8%
20.6%
34.7%
6.7%
4.5%
2012
70.0%
57.3%
27.1%
41.8%
2.9%
1.0%
2008
69.6%
57.4%
28.6%
42.0%
1.8%
0.6%
2004
64.3%
49.0%
34.8%
50.4%
0.9%
0.5%
2000
60.7%
45.0%
34.4%
52.7%
4.9%
2.4%
1996
56.9%
46.0%
32.2%
46.8%
11.0%
7.2%
Breakdown of population affiliated with a religious congregation
Type
Adherents
Congregations
Religion
San Jose
Garland
San Jose
Garland
CATHOLIC CHURCH
25.1%
18.9%
6.0%
2.4%
MUSLIM ESTIMATE
1.1%
3.6%
1.8%
1.1%
SOUTHERN BAPTIST CONVENTION
0.9%
11.0%
7.7%
31.1%
EPISCOPAL CHURCH
0.5%
1.0%
2.3%
1.5%
SEVENTH DAY ADVENTIST CHURCH
0.4%
0.5%
2.6%
1.7%
EVANGELICAL LUTHERAN CHURCH IN AMERICA
0.3%
0.3%
2.3%
0.9%
Weather
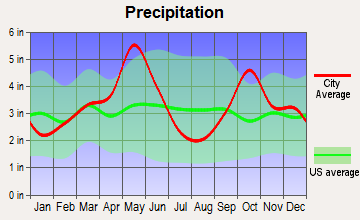
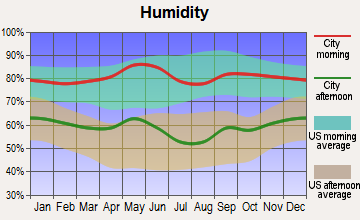
The Californian city of San Jose experiences a Mediterranean climate with warm summers and mild winters, which is ideal for those who enjoy a warmer climate. On the other hand, Garland, as part of the humid subtropical Texas, experiences hot summers and mild winters. Garland also carries higher humidity and a greater chance of storms than San Jose.
Weather and climate
Type
San Jose
Garland
Temperature - Average
60.9°F
64.5°F
Humidity - Average morning or afternoon humidity
77.3%
71.3%
Humidity - Differences between morning and afternoon humidity
35.5%
34%
Humidity - Maximum monthly morning or afternoon humidity
87%
82%
Humidity - Minimum monthly morning or afternoon humidity
51.6%
48%
Precipitation - Yearly average
16.1 in
40 in
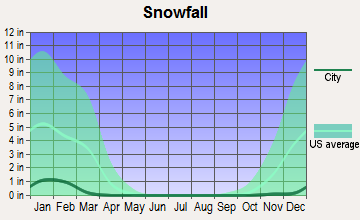
Snowfall - Yearly average
0 in
4.2 in
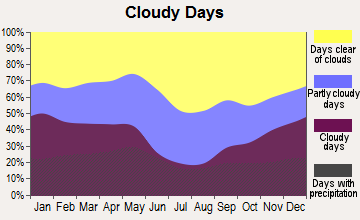
Clouds - Number of days clear of clouds
27.4%
22.8%
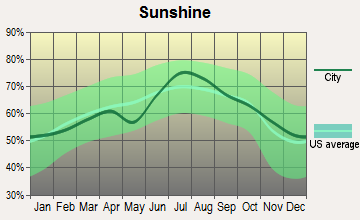
Sunshine amount - Average
73.8%
66.6%
Sunshine amount - Differences during a year
23%
20%
Sunshine amount - Maximum monthly
77.4%
74%
Sunshine amount - Minimum monthly
54.4%
54%
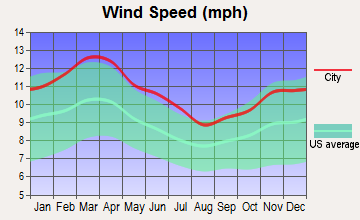
Wind speed - Average
10.3 mph
10.3 mph
Average climate in San Jose, California
Average climate in Garland, Texas
Air pollution
Type
AQI
CO
NO2
OZONE
PB
PM25
SO2
Year
San Jose
Garland
San Jose
San Jose
Garland
San Jose
Garland
San Jose
Garland
San Jose
Garland
San Jose
Garland
2018
94
86
0.49
N/A
14.5
5.8
22.2
28.4
0.006
N/A
12.5
9.7
0.2
0.4
2017
91
84
0.50
N/A
14.6
5.7
23.5
29.7
0.004
N/A
10.2
9.1
0.2
0.3
2016
69
78
0.47
N/A
13.7
6.3
22.4
28.7
0.003
N/A
8.8
8.4
0.2
0.2
2015
84
84
0.52
N/A
15.4
6.9
22.3
29.1
0.004
N/A
9.2
8.9
0.3
0.3
2014
83
83
0.40
N/A
13.9
6.3
21.5
30.1
0.004
N/A
8.2
9.9
0.2
0.3
2013
90
95
0.41
N/A
15.2
7.1
20.8
31.2
0.005
N/A
12.4
13.0
0.3
0.2
2012
74
113
0.35
N/A
13.3
8.6
21.8
32.8
0.003
N/A
10.1
12.0
0.3
0.3
2011
83
98
0.37
N/A
14.8
9.2
20.6
32.8
0.003
N/A
12.3
11.9
0.3
0.6
2010
88
79
0.35
N/A
14.4
9.6
20.4
30.0
0.004
N/A
9.0
N/A
0.4
0.7
2009
89
87
0.40
N/A
14.7
9.4
18.2
30.8
0.004
N/A
9.3
N/A
0.3
0.5
2008
100
86
0.45
N/A
16.7
9.9
20.6
30.9
N/A
0.121
12.6
N/A
N/A
0.5
2007
92
94
0.44
N/A
16.6
10.6
20.0
27.6
0.009
0.070
11.1
N/A
N/A
0.3
2006
100
107
0.46
N/A
18.0
10.6
21.8
32.3
N/A
0.106
11.1
N/A
N/A
0.7
2005
95
105
0.68
N/A
18.6
13.1
20.0
31.4
N/A
0.142
11.6
11.0
N/A
0.9
2004
98
96
0.63
N/A
18.5
12.0
20.4
28.5
N/A
0.099
9.9
N/A
N/A
0.8
2003
87
102
0.73
N/A
20.6
13.8
19.1
29.8
N/A
0.121
N/A
N/A
N/A
1.0
2002
78
97
0.65
N/A
19.5
14.2
18.0
27.7
0.006
0.080
N/A
N/A
N/A
0.4
2001
75
100
0.61
N/A
18.5
13.8
16.8
29.0
0.008
0.069
N/A
N/A
N/A
1.0
2000
65
109
0.66
N/A
18.9
14.5
15.6
29.6
0.009
0.092
N/A
N/A
N/A
1.1
Natural disasters
Type
San Jose
Garland
Tornado activity compared to U.S. average
9%
252%
Earthquake activity compared to U.S. average
7,785.3%
577.9%
Natural disasters compared to U.S. average
19%
21%
Transportation
San Jose has an excellent transportation system, including buses, light rail, and bicycles, and close proximity to various major airports. Garland, although having a well-connected road network, is more car-dependent with lesser emphasis on public transit.
Transport
Type
San Jose
Garland
Amtrak stations
1
0
Amtrak stations nearby
3
1
FAA registered aircraft
553
75
FAA registered aircraft manufacturers and dealers
13
1
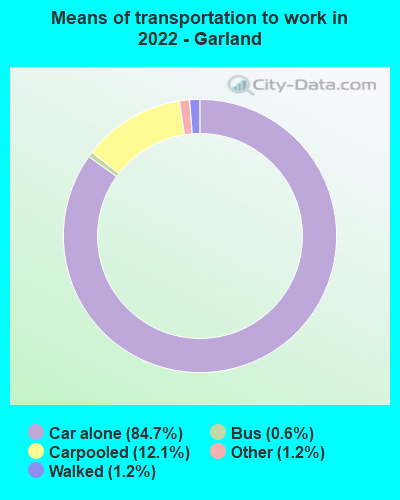
Means of transportation to work
Type
San Jose
Garland
Bicycle
1%
0.1%
Bus
1.1%
1%
Carpooled
11.4%
11.2%
Car alone
80.5%
85.3%
Motorcycle
0.2%
0.1%
Railroad
0.2%
0%
Subway
0.2%
0%
Walked
3.3%
1.4%
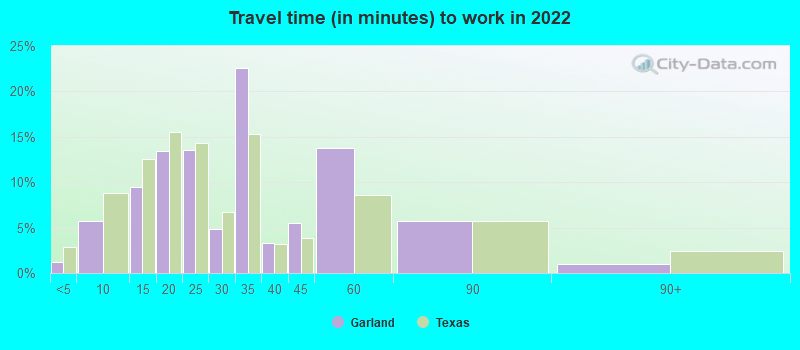
Average travel time to work
Type
San Jose
Garland
Average
29.2 min
30.2 min
Other means
27.9 min
28.8 min
Public transportation
48.5 min
48.5 min
Private vehicle occupancy
Type
San Jose
Garland
Average
1.2
1.2
Drove alone
87.3%
87%
In 2 person carpool
8.9%
9.3%
In 3 person carpool
1.9%
2.2%
In 4 person carpool
1.1%
0.8%
In 5-6 person carpool
0.6%
0.6%
In 7+ person carpool
0.2%
0.1%
How many people usually rode to work in the car, truck or van.
Real Estate
California’s high real estate values are well-reflected in San Jose, with the median home price over $1 million. In contrast, Garland has far more affordable options, with its median home price under $200,000.
Neighborhoods
San Jose has diverse neighborhoods with everything from urban apartments to suburban homes. Garland's neighborhoods typically feature single-family homes, providing a more suburban experience.
Houses and residents
Type
San Jose
Garland
Houses
340,561
80,577
Average household size (people)
3.1
3
Median year apartment built
1979
1978
Median year house/condo built
1973
1977
Length of stay in the house since moving in
15.6 years
13.7 years
Houses occupied
322,881 (94.8%)
77,777 (96.5%)
Houses occupied by owners
179,797 (55.7%)
46,943 (60.4%)
Houses occupied by renters
143,084 (44.3%)
30,834 (39.6%)
Median rent asked for vacant for-rent units
$3,214
$605.67
Median monthly housing costs
$2,463
$1,285
Median price asked for vacant for-sale houses and condos
$1,197,016
$176,480
Estimated median house or condo value
Over $1,000,000
$232,300
Median numbers of rooms
4.9
5.3
Median number of rooms in apartments
3.6
4
Median number of rooms in houses and condos
6
6
Median house price - detached houses
Over $1,000,000
$246,291
Median house price - in 2-unit structures
$753,788
$91,558
Median house price - in 3-to-4-unit structures
$680,453
$95,529
Median house price - in 5 or more unit structures
$688,625
$181,835
Median house price - mobile homes
$240,963
$186,884
Median house price - Townhouses or other attached units
$892,629
$151,380
Median house price - All housing units
Over $1,000,000
$241,433
Median house age
45
44
Renting percentage
41.5%
34.8%
Housing density (houses/condos per square mile)
1,947.6
1,410.9
House value disparities
21.2%
22.4%
Household income disparities
38.3%
41%
Median household income for houses/condes with a mortgage
$197,583
$83,676
Median household income for apartments without a mortgage
$103,711
$65,175
Housing units without a mortgage
2,632 (2.1%)
537 (1.9%)
Housing units with both a second mortgage and home equity loan
13,499 (10.6%)
674 (2.3%)
Housing units with a mortgage
124,224 (97.9%)
28,234 (98.1%)
Housing units with a home equity loan
346 (0.3%)
0 (0%)
Housing units with a second mortgage
16,249 (12.8%)
794 (2.8%)
House/condo owner moved in on average (years ago)
14
13
House/condo renter moved in on average (years ago)
3
1
Housing units lacking complete kitchen facilities
1.2%
1.2%
Housing units lacking complete plumbing facilities
0.6%
1.2%
Housing units in structures
Housing units in structures
San Jose
Garland
One, detached
50.9%
68.7%
One, attached
11.5%
2.6%
Two
1.1%
0.2%
3 or 4
5.0%
5.1%
5 to 9
5.1%
3.2%
10 to 19
4.5%
12.0%
20 to 49
4.5%
2.7%
50 or more
14.2%
4.4%
Mobile homes
3.1%
1.1%
Boats, RVs, vans, etc.
0.1%
0.0%
Median real estate property taxes paid for housing units
Self-employed workers in own not incorporated business
28,517
8,212
State government workers
10,222
2,298
Unpaid family workers
472
81
Industries and Occupations
San Jose is dominated by the tech industry, with a culture that reflects this workforce. Garland has a more diverse spread of employment sectors, including manufacturing, health care, retail, and education.
Both cities offer a variety of high-quality health care services. San Jose, with its top-tier medical centers like the Stanford Health Care and members of the Sutter Health network, offers comprehensive medical services. Garland, home to Baylor Scott & White Medical Center, provides a wide array of medical services to its residents as well.
Health (county statistics)
Type
San Jose
Garland
General health status score of residents in this county from 1 (poor) to 5 (excellent)
San Jose, with its modern infrastructure, is at the forefront of technological advancements. In contrast, Garland boasts of well-established residential and commercial infrastructure, making it a comfortable place to live in.
HMDA - Conventional home purchase loans - Applications denied
Year
San Jose
Garland
1999
3,839
916
2000
2,577
398
2001
1,953
296
2002
1,908
297
2003
3,578
750
2004
5,489
921
2005
6,994
1,370
2006
6,324
1,398
2007
4,298
794
2008
2,419
334
2009
1,631
159
Culture and Food
San Jose offers a diverse culinary scene with Mexican, Vietnamese, and other international cuisines. Garland's food culture heavily leans towards Tex-Mex and Southern BBQ along with a variety of other American dishes.
Sports Teams
San Jose is home to the San Jose Sharks (NHL) and San Jose Earthquakes (MLS). Garland, while not hosting any major sports teams, is a short drive away from Dallas, which hosts an array of sports teams across various leagues, including the Dallas Cowboys (NFL) and the Dallas Mavericks (NBA).
 San Jose, CA
 Garland, TX