Both Seattle, Washington, and Boston, Massachusetts, are progressive cities with rich histories, numerous job opportunities, and distinct cultures. However, they differ in climate, cost of living, and socio-economic dynamics. This comprehensive comparison between the two cities touches on various important aspects including safety, weather, living costs, and transportation to offer a detailed view of what it's like to live or visit either city.
Distance between
Seattle, WA and
Boston, MA : 2,485.0 miles
Seattle's population is larger by 12%. Its population has grown by 170,545 people (30.3%) since 2000. The population of Boston has grown by 65,635 people (11.1%) during that time.
In terms of crime rates, Seattle has a considerably higher rate than Boston. However, both cities have safe neighborhoods as well as areas that may present more safety concerns. Both cities are investing in public safety, particularly in improving community policing and dealing with issues related to homelessness and drug use. Tourists generally find both cities safe, so long as they take the general precautions typical of any major city.
City-data.com crime index counts serious crimes and violent crime more heavily. It adjusts for the number of visitors and daily workers commuting into cities. (higher means more crime, U.S. average = 301.1)
City-data.com crime index counts serious crimes and violent crime more heavily. It adjusts for the number of visitors and daily workers commuting into cities. (higher means more crime, U.S. average = 301.1)
Sex Offenders
According to our data, there are 481 registered sex offenders living in Seattle and 331 registered sex offenders living in . The ratio of residents to sex offenders in Seattle is 1,464 to 1; the ratio in Boston is 2,033 to 1. The number of registered sex offenders compared to the number of residents is larger in Seattle than in Boston.
Cost of Living
Boston's cost of living is generally higher than Seattle's, particularly in terms of housing. Seattle, however, is not far behind, especially with the increase in home prices in recent years. Other costs, such as groceries, utilities, and transportation, also tend to be higher in Boston than in Seattle.
Income Tax
Seattle residents enjoy the advantage of not having to pay any city or state income tax. On the other hand, Boston residents are subject to a state income tax rate of around 5%.
Property Tax
Residents of both Seattle and Boston pay city and state property taxes. Property tax rates in Boston tend to be lower than in Seattle, although this is somewhat offset by the generally higher property values in Boston.
Sales Tax
Washington has a higher sales tax than Massachusetts, which may impact the cost of living for residents and tourists. However, there is no income tax in Washington, unlike Massachusetts where both state and city income taxes apply.
Income
Type
Seattle
Boston
Estimated median household income
$110,781
$79,283
Estimated per capita income
$74,733
$50,337
Cost of living index (U.S. average is 100)
118.5
143.8
If you make $50,000 in Seattle, you will have to make $60,675 in Boston to maintain the same standard of living.
Geographical Conditions
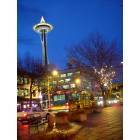
Seattle is known for its hilly landscape, lush greenery, and gorgeous Pacific Northwest scenic beauty, including views of Mount Rainier. It's also surrounded by water, with numerous lakes and Puget Sound. Boston, on the other hand, boasts its beautiful harbor, the Charles River, and historic sites along The Freedom Trail. It is less hilly than Seattle and is well-known for its walkability.
Both cities are renowned for being educational powerhouses. Boston boasts prestigious institutions like Harvard University and MIT, while Seattle hosts the University of Washington. Both cities have robust public school systems, and place a high priority on education, making either city an attractive place to live for families.
Seattle and Boston both offer a vibrant job market. Seattle is the birthplace of giants like Amazon and Microsoft, and is rich in tech jobs. Boston, on the other hand, is a global leader in the medical, biotech, and higher education sectors. Both cities have diverse economies, with opportunities for various skill sets and levels of experience.
Biggest Employers
The biggest employers in Seattle are Amazon, Microsoft, and the University of Washington. In Boston, the top employers are institutions like Massachusetts General Hospital, Brigham and Women's Hospital, Boston University, and Harvard.
There were 264 building permits issued in Seattle in 2012 (52 less than in 2011) compared to 53 building permits issued in Boston in 2012 (20 more than in 2011).
In Seattle (King County), 69.0% voted for Democrats and 28.5% for Republicans in 2012 Presidential Election. In Boston (Suffolk County), 77.4% voted for Democrats and 20.8% for Republicans.
Elections
Type
Democrats
Republicans
Other
Year
Seattle
Boston
Seattle
Boston
Seattle
Boston
2020
75.1%
80.6%
22.3%
17.5%
2.6%
1.9%
2016
70.0%
78.5%
21.1%
16.1%
8.9%
5.4%
2012
69.0%
77.4%
28.5%
20.8%
2.5%
1.8%
2008
70.2%
76.9%
28.1%
21.2%
1.7%
1.8%
2004
65.1%
75.9%
33.8%
22.8%
1.1%
1.3%
2000
60.3%
71.5%
34.5%
20.5%
5.2%
8.0%
1996
56.4%
73.0%
31.4%
19.9%
12.2%
7.0%
Breakdown of population affiliated with a religious congregation
Type
Adherents
Congregations
Religion
Seattle
Boston
Seattle
Boston
CATHOLIC CHURCH
14.4%
46.1%
4.9%
12.4%
EVANGELICAL LUTHERAN CHURCH IN AMERICA
1.3%
0.0%
4.7%
0.7%
EPISCOPAL CHURCH
0.8%
1.0%
2.4%
4.7%
AMERICAN BAPTIST CHURCHES IN THE USA
0.6%
1.2%
2.9%
8.9%
MUSLIM ESTIMATE
0.6%
1.1%
1.4%
2.4%
SEVENTH DAY ADVENTIST CHURCH
0.6%
0.7%
2.3%
4.0%
LUTHERAN CHURCH
0.5%
0.1%
2.0%
0.4%
SOUTHERN BAPTIST CONVENTION
0.3%
0.6%
3.8%
6.9%
Weather
Seattle and Boston have distinctly different climates. Seattle mostly experiences mild, wet winters and warm, dry summers. Its reputation for rain is somewhat exaggerated, with the city receiving less annual rainfall than many eastern cities, but the rain does tend to be spread out over many cloudy, drizzly days. On the other hand, Boston experiences a humid continental climate with cold, snowy winters and warm, humid summers. Both cities have their own charm and offer unique outdoor experiences.
Weather and climate
Type
Seattle
Boston
Temperature - Average
52.5°F
50.6°F
Humidity - Average morning or afternoon humidity
78.5%
69.9%
Humidity - Differences between morning and afternoon humidity
38%
23.1%
Humidity - Maximum monthly morning or afternoon humidity
86%
78%
Humidity - Minimum monthly morning or afternoon humidity
48%
55%
Precipitation - Yearly average
36.6 in
46.3 in
Snowfall - Yearly average
21.4 in
88.3 in
Clouds - Number of days clear of clouds
11.6%
16.4%
Sunshine amount - Average
49.4%
63.7%
Sunshine amount - Differences during a year
44%
20%
Sunshine amount - Maximum monthly
64%
68%
Sunshine amount - Minimum monthly
20%
48%
Wind speed - Average
8.6 mph
12.5 mph
Average climate in Seattle, Washington
Average climate in Boston, Massachusetts
Air pollution
Type
AQI
CO
NO2
OZONE
PB
PM10
PM25
SO2
Year
Seattle
Boston
Seattle
Boston
Seattle
Boston
Seattle
Boston
Seattle
Seattle
Seattle
Boston
Seattle
Boston
2018
82
76
0.21
0.24
10.6
12.3
20.7
26.1
N/A
N/A
N/A
N/A
8.3
9.2
0.7
0.5
2017
92
83
0.23
0.26
11.1
12.5
21.0
26.4
N/A
N/A
N/A
N/A
8.8
8.9
0.3
0.6
2016
67
75
0.22
0.27
11.9
14.1
20.3
24.4
N/A
N/A
N/A
N/A
6.6
7.4
0.6
0.5
2015
81
81
0.23
0.30
10.8
15.7
19.3
23.4
N/A
N/A
N/A
N/A
8.5
8.9
0.8
0.8
2014
75
76
0.24
0.30
11.5
14.0
19.5
24.5
N/A
N/A
N/A
N/A
7.4
9.3
N/A
1.2
2013
81
86
0.24
0.30
N/A
13.5
17.4
26.2
N/A
N/A
N/A
N/A
9.1
9.8
0.8
1.3
2012
77
89
0.23
0.29
N/A
11.8
19.5
23.5
N/A
N/A
N/A
N/A
7.7
9.5
1.0
1.4
2011
72
87
0.24
0.30
N/A
14.8
18.6
24.2
N/A
N/A
N/A
N/A
7.5
10.5
1.1
1.6
2010
71
92
0.24
0.26
N/A
13.8
18.0
25.0
N/A
N/A
N/A
N/A
6.7
10.0
1.1
2.3
2009
94
86
0.27
0.32
N/A
15.3
17.7
23.5
N/A
N/A
N/A
N/A
8.0
9.7
1.4
2.4
2008
80
96
0.30
0.26
N/A
16.6
17.8
22.9
N/A
N/A
N/A
N/A
6.5
12.4
1.3
3.8
2007
83
124
0.30
0.28
N/A
18.5
18.2
19.9
N/A
N/A
20.3
N/A
7.9
13.9
1.5
4.0
2006
98
103
N/A
0.38
N/A
15.8
18.3
20.9
N/A
N/A
22.6
N/A
8.7
12.5
N/A
3.5
2005
101
115
0.80
0.28
18.3
17.0
N/A
22.1
N/A
N/A
24.5
N/A
9.5
12.7
3.5
4.3
2004
102
104
0.81
0.26
17.9
15.6
N/A
22.5
N/A
N/A
N/A
N/A
10.3
13.7
3.0
4.6
2003
91
116
0.78
0.55
18.5
20.1
N/A
22.4
N/A
N/A
N/A
N/A
9.9
14.5
2.4
5.2
2002
87
130
0.82
0.35
19.3
19.8
N/A
21.8
N/A
N/A
N/A
N/A
11.7
13.5
2.7
5.0
2001
88
112
0.90
0.44
20.7
19.9
N/A
20.7
0.005
N/A
N/A
N/A
12.3
13.6
3.7
5.9
2000
98
88
1.06
0.57
20.9
18.8
N/A
19.2
N/A
N/A
N/A
N/A
13.3
10.0
3.2
5.6
Natural disasters
Type
Seattle
Boston
Tornado activity compared to U.S. average
5.5%
55.3%
Earthquake activity compared to U.S. average
1,394.2%
26.6%
Natural disasters compared to U.S. average
30%
33%
Transportation
Boston's public transportation system, the Massachusetts Bay Transportation Authority, is more extensive than Seattle's King County Metro. However, both cities offer a variety of public transportation options, including buses, light rail, and commuter trains. Both cities are also bike-friendly and walkable, especially in and around downtown areas.
Transport
Type
Seattle
Boston
Amtrak stations
1
3
Amtrak stations nearby
2
3
FAA registered aircraft
1
224
FAA registered aircraft manufacturers and dealers
2
4
Means of transportation to work
Type
Seattle
Boston
Bicycle
2.1%
1.7%
Bus
8.9%
7.1%
Carpooled
8.7%
6.8%
Car alone
67.8%
54.7%
Ferryboat
0.7%
0.2%
Motorcycle
0.3%
0.1%
Railroad
1.2%
0.5%
Streetcar
0.3%
13.5%
Subway
0.6%
3.2%
Taxicab
0.1%
0.4%
Walked
8%
10%
Average travel time to work
Type
Seattle
Boston
Average
35 min
38.6 min
Other means
23.5 min
26.1 min
Public transportation
35.6 min
38.6 min
Private vehicle occupancy
Type
Seattle
Boston
Average
1.2
1.2
Drove alone
89%
87.1%
In 2 person carpool
8.7%
10.1%
In 3 person carpool
0.8%
1.7%
In 4 person carpool
0.2%
0.4%
In 5-6 person carpool
1.1%
0.2%
In 7+ person carpool
0.2%
0.5%
How many people usually rode to work in the car, truck or van.
Real Estate
While both cities grapple with high real estate prices, Boston's housing market is generally more expensive than Seattle's. On the rental side, Seattle is becoming increasingly expensive, although it is still slightly more affordable than Boston.
Neighborhoods
Both Seattle and Boston offer a variety of neighborhoods, each with its own unique characteristics. In Seattle, the Ballard, Fremont, and Capitol Hill neighborhoods are popular, each offering a unique mix of local eateries, shops, and culture. Boston's Back Bay, Beacon Hill, and North End neighborhoods are full of historic charm and local character.
Houses and residents
Type
Seattle
Boston
Houses
384,799
307,025
Average household size (people)
2.1
2.3
Median year apartment built
1987
1957
Length of stay in the house since moving in
12.4 years
14.6 years
Houses occupied
351,650 (91.4%)
271,941 (88.6%)
Houses occupied by owners
161,587 (46%)
94,497 (34.7%)
Houses occupied by renters
190,063 (54%)
177,444 (65.3%)
Median rent asked for vacant for-rent units
$2,780
$2,632
Median monthly housing costs
$1,984
$1,883
Median price asked for vacant for-sale houses and condos
$860,506
$1,040,328
Estimated median house or condo value
$848,100
$659,700
Median numbers of rooms
4.1
4.3
Median number of rooms in apartments
3
3.9
Median number of rooms in houses and condos
6.3
5.4
Median house price - detached houses
Over $1,000,000
$683,896
Median house price - in 2-unit structures
$764,579
$639,493
Median house price - in 3-to-4-unit structures
$719,049
$745,440
Median house price - in 5 or more unit structures
$626,370
$986,433
Median house price - mobile homes
$226,727
$117,668
Median house price - Townhouses or other attached units
$925,507
Over $1,000,000
Median house price - All housing units
Over $1,000,000
$793,380
Median house age
47
73
Renting percentage
51.9%
66.1%
Housing density (houses/condos per square mile)
4,587.9
6,340.1
House value disparities
20.6%
23.5%
Household income disparities
42.2%
48.2%
Median household income for houses/condes with a mortgage
$189,767
$138,364
Median household income for apartments without a mortgage
$112,771
$97,179
Housing units without a mortgage
2,459 (2.1%)
1,250 (1.8%)
Housing units with both a second mortgage and home equity loan
12,354 (10.5%)
7,686 (11.2%)
Housing units with a mortgage
115,481 (97.9%)
67,144 (98.2%)
Housing units with a home equity loan
240 (0.2%)
218 (0.3%)
Housing units with a second mortgage
13,881 (11.8%)
9,540 (13.9%)
House/condo owner moved in on average (years ago)
8
12
House/condo renter moved in on average (years ago)
1
3
Housing units lacking complete kitchen facilities
2.2%
1.4%
Housing units lacking complete plumbing facilities
0.4%
0.7%
Housing units in structures
Housing units in structures
Seattle
Boston
One, detached
39.6%
12.0%
One, attached
6.0%
6.4%
Two
2.0%
11.9%
3 or 4
3.2%
24.1%
5 to 9
5.7%
11.2%
10 to 19
7.0%
7.2%
20 to 49
11.9%
8.0%
50 or more
24.4%
19.0%
Mobile homes
0.1%
0.1%
Median real estate property taxes paid for housing units
Self-employed workers in own not incorporated business
24,994
11,605
State government workers
27,235
12,810
Unpaid family workers
947
303
Industries and Occupations
In Seattle, the most prevalent industries include technology, healthcare, manufacturing, and retail trade. In contrast, Boston's economy is more diversified with finance, education, healthcare, and technology leading the pack. Both cities also host vibrant startup scenes, providing numerous opportunities for entrepreneurs.
Both Seattle and Boston feature robust healthcare systems. In Seattle, the University of Washington Medical Center and Swedish Health Services are among the top providers. Boston is acknowledged as a global leader in healthcare with world-class institutions like Massachusetts General Hospital and Brigham and Women's Hospital.
Health (county statistics)
Type
Seattle
Boston
General health status score of residents in this county from 1 (poor) to 5 (excellent)
Seattle showcases a mixture of modern architecture along with natural beauty, while Boston's infrastructure displays its rich history intertwined with contemporary developments. Boston's colonial era layout can make navigation a bit challenging, but also contributes to the city's unique charm. Seattle's infrastructure is more modern and designed with the city's hilly geographical nature in mind.
Infrastructure
Type
Seattle
Boston
Hospitals
22
22
TV stations
17
22
Arenas or stadiums
5
3
Bank branches located here
236
146
Bank institutions located here
37
37
Main business address for public companies
54
60
Drinking water stations with no reported violations in the past
3
2
Drinking water stations with reported violations in the past
HMDA - Conventional home purchase loans - Applications denied
Year
Seattle
Boston
1999
1,357
1,237
2000
1,148
1,140
2001
890
947
2002
840
975
2003
1,421
1,536
2004
1,810
2,273
2005
2,341
3,225
2006
2,789
3,567
2007
2,273
2,652
2008
1,113
1,372
2009
748
910
Culture and Food
Culture and food are areas where both cities shine. Seattle is known for its coffee culture, music scene, and outdoor activities. Its seafood, particularly salmon, is not to be missed. Boston's rich history, excellent seafood, especially clam chowder, and strong sports culture set it apart. Both cities have a wide range of cultural institutions, including museums, art galleries, theatres, and music venues.
Sports Teams
In terms of sports, Seattle has the Seahawks (NFL), Mariners (MLB), Sounders (MLS), and the Kraken (NHL). Boston is home to the Red Sox (MLB), Celtics (NBA), Bruins (NHL), and the Patriots (NFL in nearby Foxborough). The sports culture is strong in both cities, adding to their vibrance and community spirit.


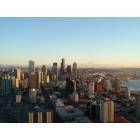


 Seattle, WA
 Boston, MA


