The comparison between Staten Island, NY, and Raleigh, NC, revolves around factors like safety, climate, economy, cost of living, education, healthcare, and more. As Staten Island is part of the bustling New York City, it presents a distinctly urban lifestyle marked by diversity and rapid commute, while Raleigh offers a more laid-back environment with comparatively lower living costs. This article will delve into several aspects to detail how living in these two cities might vary.
Staten Island, despite being part of New York City, is relatively safe with crime rates closer to the national average. Neighborhoods like New Dorp or Todt Hills exhibit exceptional safety standards. Raleigh also boasts lower crime rates compared to the national average, making it a safe choice for families and individuals alike. Both cities invest heavily in public safety, with significant presence of law enforcement in public areas.
Cost of Living
Living in Staten Island is significantly more expensive than Raleigh. Housing, grocery prices, and transportation are higher in Staten Island due to its location within New York City. Raleigh is favored for its lower cost of living. However, wages in New York are typically higher to offset the cost discrepancies.
Income Tax
New York state has a progressive income tax system, ranging from 4% to 8.82%, and NYC residents pay an additional city tax. North Carolina has a flat income tax rate of 5.25%.
Property Tax
Property tax rates in Staten Island are decided by NYC and stand around 0.88%. Raleigh has a higher property tax rate of 0.996%.
Sales Tax
New York City, including Staten Island, has a relatively high combined city and state sales tax rate of 8.875%. Raleigh, North Carolina, stands at a lower 7.25%.
Income
Type
Staten Island
Raleigh
Estimated median household income
$86,054
$74,612
Estimated per capita income
$38,678
$44,001
Cost of living index (U.S. average is 100)
164.1
95.1
If you make $50,000 in Raleigh, you will have to make $86,278 in Staten Island to maintain the same standard of living.
Geographical Conditions
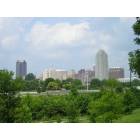
Staten Island, surrounded by the Atlantic Ocean and the Hudson River, is hilly with a coastline featuring cliffs and beaches. Raleigh is characterized by gently rolling hills and dense hardwood and pine forests.
Geographical information
Type
Staten Island
Raleigh
Land area
58.5 sq. miles
114.6 sq. miles
Population density
8,225.7 people per sq. mile
4,093.6 people per sq. mile
Relative area comparison
Staten Island, NY Raleigh, NC
Education
Both cities are strong in terms of education. Staten Island has a variety of reputable schools and access to renowned educational institutions in other boroughs of NYC. Raleigh is also known for its high-quality schools and is close to well-regarded universities such as North Carolina State University and Duke University.
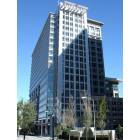
Staten Island's economy is tied with the wider New York economy; finance, healthcare, retail trade, and education being key sectors. Raleigh, part of the Research Triangle, shows strength in sectors like tech, healthcare, and education. Both cities enjoy low unemployment rates.
Biggest Employers
In Staten Island, NYC government is the largest employer, followed by Staten Island University Hospital, and Richmond University Medical Center. Raleigh's notable employers are the state of North Carolina, Wake County Public School System, and North Carolina State University.
In Staten Island (Richmond County), 50.8% voted for Democrats and 48.3% for Republicans in 2012 Presidential Election. In Raleigh (Wake County), 54.9% voted for Democrats and 43.5% for Republicans.
Elections
Type
Democrats
Republicans
Other
Year
Staten Island
Raleigh
Staten Island
Raleigh
Staten Island
Raleigh
2020
42.2%
62.3%
57.1%
35.9%
0.7%
1.8%
2016
41.0%
57.4%
56.1%
37.2%
2.9%
5.5%
2012
50.8%
54.9%
48.3%
43.5%
0.9%
1.6%
2008
47.8%
56.8%
51.9%
42.3%
0.4%
0.9%
2004
42.8%
48.7%
56.5%
50.9%
0.7%
0.4%
2000
52.1%
46.1%
45.1%
53.2%
2.9%
0.7%
1996
50.5%
45.9%
40.8%
48.2%
8.7%
5.9%
Breakdown of population affiliated with a religious congregation
Type
Adherents
Congregations
Religion
Staten Island
Raleigh
Staten Island
Raleigh
CATHOLIC CHURCH
54.2%
11.0%
20.6%
2.4%
MUSLIM ESTIMATE
1.7%
1.1%
3.0%
1.0%
AMERICAN BAPTIST CHURCHES IN THE USA
0.6%
0.4%
1.0%
0.6%
EVANGELICAL LUTHERAN CHURCH IN AMERICA
0.6%
0.6%
4.0%
1.1%
COPTIC ORTHODOX CHURCH
0.5%
0.1%
1.0%
0.1%
EPISCOPAL CHURCH
0.4%
1.1%
5.0%
1.8%
LUTHERAN CHURCH
0.2%
0.4%
1.5%
0.6%
SOUTHERN BAPTIST CONVENTION
0.2%
9.0%
3.5%
22.5%
Weather
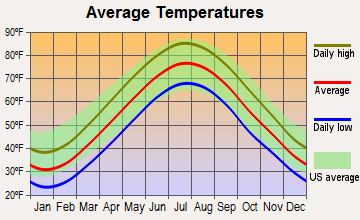
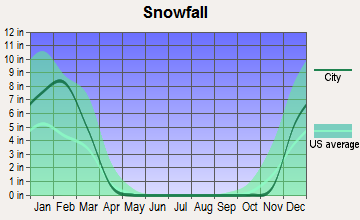
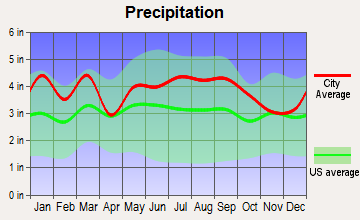
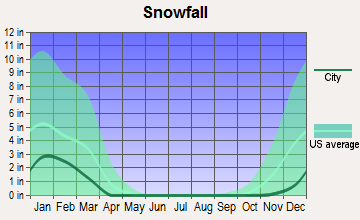
Climate is a significant difference between Staten Island and Raleigh. The former has a temperate maritime climate, experiencing cold winters and hot, humid summers. Snowfall is common during winter in Staten Island. On the other hand, Raleigh experiences a subtropical climate where summers are hot and humid, with mild and short winters.
Weather and climate
Type
Staten Island
Raleigh
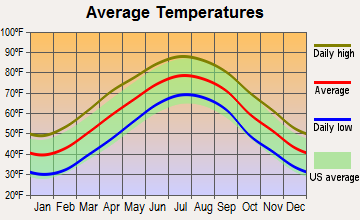
Temperature - Average
54.1°F
59.8°F
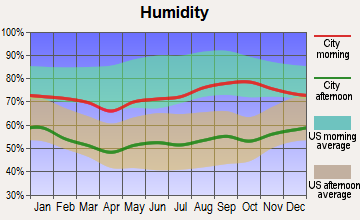
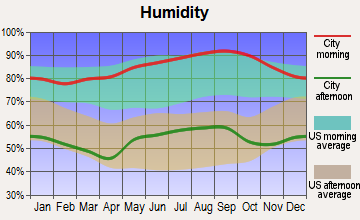
Humidity - Average morning or afternoon humidity
67.4%
73.7%
Humidity - Differences between morning and afternoon humidity
29.9%
44%
Humidity - Maximum monthly morning or afternoon humidity
77%
90%
Humidity - Minimum monthly morning or afternoon humidity
47.2%
46%
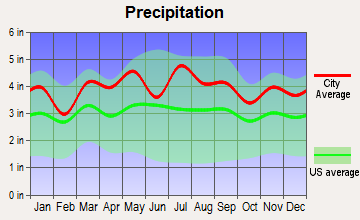
Precipitation - Yearly average
47.4 in
46.2 in
Snowfall - Yearly average
60 in
13.4 in
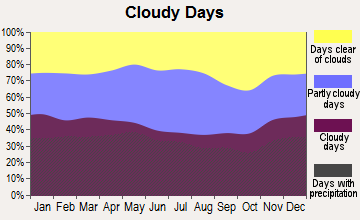
Clouds - Number of days clear of clouds
15.8%
18.5%
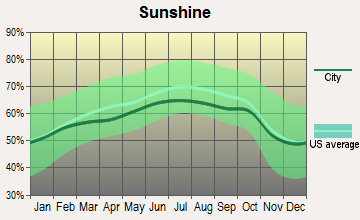
Sunshine amount - Average
60.2%
63.9%
Sunshine amount - Differences during a year
20%
13%
Sunshine amount - Maximum monthly
64%
64%
Sunshine amount - Minimum monthly
44%
51%
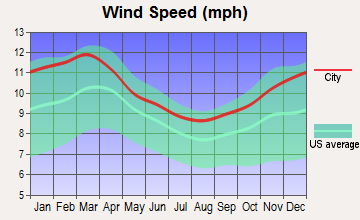
Wind speed - Average
10.5 mph
7.1 mph
Average climate in Staten Island, New York
Average climate in Raleigh, North Carolina
Air pollution
Type
AQI
CO
NO2
OZONE
PB
PM10
PM25
SO2
Year
Staten Island
Raleigh
Staten Island
Raleigh
Staten Island
Raleigh
Staten Island
Raleigh
Staten Island
Staten Island
Raleigh
Staten Island
Raleigh
Staten Island
Raleigh
2018
94
71
0.35
0.23
17.1
4.9
24.1
27.5
N/A
N/A
N/A
14.6
7.9
9.5
0.4
0.2
2017
98
70
0.32
0.23
17.0
5.5
27.0
25.8
N/A
N/A
N/A
14.7
7.6
9.3
0.2
0.2
2016
94
80
0.37
0.23
17.9
5.6
28.5
26.9
N/A
N/A
N/A
8.7
7.7
10.0
0.2
0.3
2015
102
79
0.39
0.27
18.9
5.7
27.3
28.6
N/A
N/A
N/A
12.4
8.6
11.0
0.4
0.3
2014
97
74
0.38
0.26
19.2
6.0
25.6
29.9
N/A
N/A
N/A
N/A
8.3
11.2
0.7
0.3
2013
99
72
0.39
0.26
19.6
N/A
27.8
26.9
N/A
N/A
N/A
N/A
8.5
10.7
0.8
0.4
2012
102
80
0.42
0.28
19.3
N/A
26.9
29.7
N/A
N/A
N/A
N/A
9.2
9.5
1.4
0.6
2011
108
84
0.42
0.27
21.4
N/A
28.1
32.9
N/A
N/A
N/A
N/A
10.2
10.3
2.0
0.7
2010
114
89
0.40
0.30
19.9
N/A
28.7
32.4
N/A
N/A
N/A
N/A
9.4
10.9
1.8
1.0
2009
105
77
0.39
0.30
22.5
N/A
25.3
27.8
N/A
N/A
N/A
N/A
9.5
10.3
2.4
1.0
2008
111
99
0.39
0.36
23.0
N/A
24.3
32.3
0.013
N/A
N/A
N/A
11.3
12.5
3.4
1.4
2007
123
98
0.44
0.40
24.2
N/A
23.3
35.7
0.016
N/A
N/A
N/A
12.0
13.9
4.3
1.2
2006
117
90
0.55
0.44
25.6
N/A
24.7
31.9
0.018
N/A
N/A
N/A
13.1
13.5
5.3
0.9
2005
112
80
0.69
0.38
27.3
N/A
23.3
33.9
N/A
N/A
N/A
N/A
N/A
N/A
7.3
2.5
2004
109
82
0.68
0.40
26.4
N/A
22.2
28.4
0.030
N/A
N/A
N/A
N/A
N/A
6.9
2.6
2003
112
82
0.76
N/A
28.0
N/A
22.1
29.9
0.006
N/A
26.9
N/A
N/A
N/A
7.1
3.0
2002
125
89
0.74
N/A
30.6
N/A
24.7
36.1
0.008
N/A
26.1
N/A
N/A
N/A
6.6
2.6
2001
124
128
0.81
N/A
32.4
N/A
24.9
34.5
0.020
N/A
26.9
N/A
N/A
N/A
7.2
N/A
2000
116
115
0.93
0.64
33.0
N/A
23.1
34.1
0.022
N/A
22.2
N/A
N/A
N/A
7.2
N/A
Natural disasters
Type
Staten Island
Raleigh
Tornado activity compared to U.S. average
61.3%
95.1%
Earthquake activity compared to U.S. average
31.2%
52.6%
Natural disasters compared to U.S. average
19%
18%
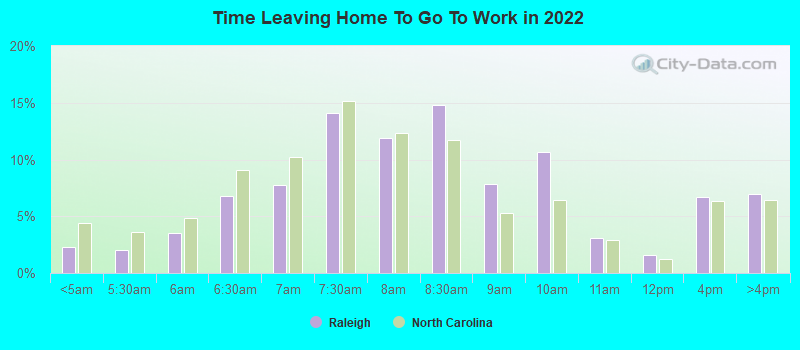
Transportation
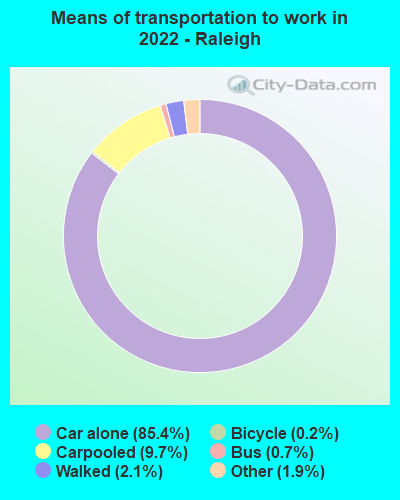
Staten Island offers a variety of public transport including buses, railways and a free Staten Island Ferry. Raleigh's transit system offers bus services, and biking is a popular commuting option. Both cities also have extensive road networks for those who prefer driving.
Transport
Type
Staten Island
Raleigh
Amtrak stations
0
1
Amtrak stations nearby
3
3
FAA registered aircraft
39
499
FAA registered aircraft manufacturers and dealers
2
12
Means of transportation to work
Type
Staten Island
Raleigh
Bicycle
0.2%
0.2%
Bus
19.2%
1.1%
Carpooled
12.1%
8.5%
Car alone
54.3%
87.4%
Ferryboat
5.3%
0.1%
Motorcycle
0.1%
0.1%
Railroad
0.9%
0%
Subway
2.6%
0%
Taxicab
0.4%
0.3%
Walked
2.9%
1.1%
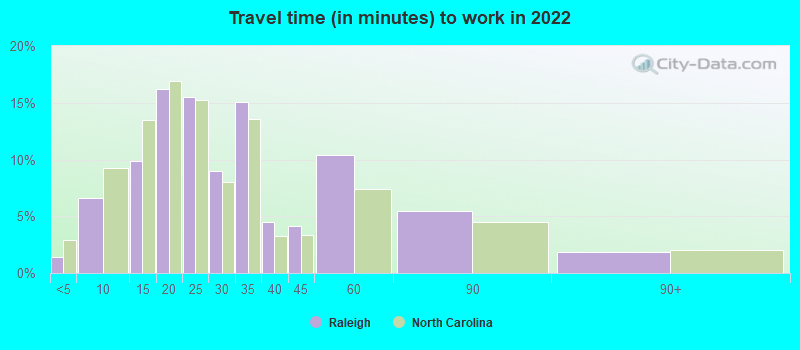
Average travel time to work
Type
Staten Island
Raleigh
Average
45.3 min
29.4 min
Real Estate
Real estate prices are markedly higher in Staten Island compared to Raleigh, largely influenced by its proximity to Manhattan. Despite this, Staten Island's housing cost is relatively low compared to other NYC boroughs. Raleigh real estate is more affordable, offering value for money in terms of house size and amenities.
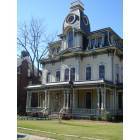
Neighborhoods
Staten Island is known for its diverse and upscale neighborhoods, such as St. George, Todt Hill, and South Beach. Raleigh offers a mix of historic neighborhoods like Boylan Heights or Mordecai, and newer suburban areas like Brier Creek and North Hills.
Houses and residents
Type
Staten Island
Raleigh
Houses
163,993
217,866
Average household size (people)
2.8
2.4
Houses occupied
156,341 (95.3%)
194,917 (89.5%)
Houses occupied by owners
99,732 (63.8%)
103,367 (53%)
Houses occupied by renters
56,609 (36.2%)
91,550 (47%)
Median rent asked for vacant for-rent units
$1,320
$1,740
Median price asked for vacant for-sale houses and condos
$369,853
$302,120
Estimated median house or condo value
$605,500
$340,200
Median number of rooms in apartments
3.9
3.9
Median number of rooms in houses and condos
6.1
6.7
Renting percentage
35.9%
46.5%
Housing density (houses/condos per square mile)
2,804.3
1,901.1
Household income disparities
43.8%
45.4%
Housing units without a mortgage
19,289 (25%)
1,689 (2.1%)
Housing units with both a second mortgage and home equity loan
160 (0.2%)
6,627 (8.2%)
Housing units with a mortgage
57,986 (75%)
78,923 (97.9%)
Housing units with a home equity loan
5,623 (7.3%)
0 (0%)
Housing units with a second mortgage
4,499 (5.8%)
7,783 (9.7%)
Housing units lacking complete kitchen facilities
0.6%
0.6%
Housing units lacking complete plumbing facilities
Self-employed workers in own not incorporated business
7,611
12,488
State government workers
6,285
19,792
Unpaid family workers
394
523
Industries and Occupations
In Staten Island, major industries are health care, retail trade, and educational services. Raleigh thrives on tech industry, with many residents working in occupations related to technology, healthcare, and education.
Staten Island provides access to top-notch healthcare through NYC's integrated healthcare system. Raleigh's healthcare is also outstanding, as the Research Triangle area is a hub for healthcare and biomedical research.
Infrastructure in Staten Island is well-developed, with a robust network of roads, bridges, and an adequate public transportation system. Raleigh also boasts strong infrastructure with steady investements in roads, parks and public utilities.
Infrastructure
Type
Staten Island
Raleigh
Hospitals
25
19
TV stations
30
20
Bank branches located here
104
136
Bank institutions located here
19
27
Main business address for public companies
1
21
Nuclear power plants nearby
0
1
Drinking water stations with no reported violations in the past
1
2
Drinking water stations with reported violations in the past
3
55
Schools
School facilities
Type
Staten Island
Raleigh
Private elementary/middle schools
22
15
Private high schools
13
20
Public elementary/middle schools
63
75
Public high schools
16
21
Colleges/Universities
5
13
Culture and Food
Staten Island is rich in culture and food, being part of the diverse New York City. There is a wide variety of culinary options and cultural institutions. Raleigh, often called the "Smithsonian of the South", also offers numerous cultural events, music festivals, and a thriving culinary scene featuring Southern and global cuisines.
Sports Teams
Staten Island has minor league teams and gives access to major NYC sports teams in various sports. Raleigh is home to National Hockey League's Carolina Hurricanes, and close to many significant collegiate sports programs.


 Staten Island, NY
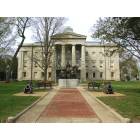
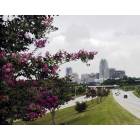
 Raleigh, NC