Comparing Washington, DC and Fort Wayne, IN reveals distinct differences, making each city ideal for different types of people. The living environments vary substantially; Washington, DC, being the capital, offers a vibrant, cosmopolitan lifestyle with an array of job opportunities, historic landmarks, and cultural diversity, while Fort Wayne, with its slower pace, offers affordability, a strong sense of community, and substantial recreational opportunities. The key distinctions between the two can be found in areas such as crime/safety, weather, cost of living, education, work and economy, infrastructure, industries and occupations, biggest employers, real-estate, and others as further elaborated below.
Distance between
Washington, DC and
Fort Wayne, IN : 454.5 miles
Washington's population is larger by 152%. Its population has grown by 97,991 people (17.1%) since 2000. The population of Fort Wayne has grown by 60,247 people (29.3%) during that time.
Washington, DC, being a heavily populated city, has a somewhat higher crime rate as compared to Fort Wayne. However, the city is proactive in implementing safety measures, and crime rates vary by neighborhood. Tourists, meanwhile, are reassured by the high security surrounding many high-traffic landmarks and areas. Fort Wayne, by contrast, has a relatively low crime rate, making it a safe place to visit and live, particularly for families.
City-data.com crime index counts serious crimes and violent crime more heavily. It adjusts for the number of visitors and daily workers commuting into cities. (higher means more crime, U.S. average = 301.1)
City-data.com crime index counts serious crimes and violent crime more heavily. It adjusts for the number of visitors and daily workers commuting into cities. (higher means more crime, U.S. average = 301.1)
Sex Offenders
According to our data, there are 1,072 registered sex offenders living in Washington and 18 registered sex offenders living in . The ratio of residents to sex offenders in Washington is 635 to 1; the ratio in Fort Wayne is 14,519 to 1. The number of registered sex offenders compared to the number of residents is much larger in Washington than that in Fort Wayne.
Cost of Living
The cost of living in Washington, DC is significantly higher than in Fort Wayne. This includes housing, meals, groceries, and entertainment. Fort Wayne is considered one of the most affordable cities in America, offering a much lower cost of living with a comfortable lifestyle.
Income Tax
DC has a progressive income tax structure that ranges from 4% to 8.95%, while Indiana has a flat state income tax rate of 3.23%, with an additional county tax that can range from 0.1% to 3.13%.
Property Tax
DC's average property tax is 0.56%, while Indiana's average stands at 0.87%. However, owing to DC's higher property values, actual costs can be considerably higher in the capital.
Sales Tax
Sales tax in Washington, DC is 5.75%, which is higher than Indiana's state sales tax rate of 7%. Fort Wayne adds no additional city sales tax.
Income
Type
Washington
Fort Wayne
Estimated median household income
$90,088
$54,737
Estimated per capita income
$65,808
$29,282
Cost of living index (U.S. average is 100)
124.2
82.8
If you make $50,000 in Fort Wayne, you will have to make $75,000 in Washington to maintain the same standard of living.
Geographical Conditions
DC, located on the Potomac River, showcases a variety of landscapes from parks to waterways. Fort Wayne is characterized by its flat topography, with three rivers intersecting the city.
Washington, DC boasts top-tier universities as well as a vast array of public, charter, and private schools. Schools in the DC area often rank high nationally, attracting families with school-aged children. Fort Wayne also offers a respectable education system with various public and private schools, along with colleges and universities.
Being a center for federal government operations, Washington, DC has high rates of employment in government roles. It also thrives in areas like education, health, and professional services. Fort Wayne's economy leans more on manufacturing, health care, and the retail trade, with a growing technology sector.
Biggest Employers
Outstanding employers in Washington, DC include the federal government, MedStar Health, and George Washington University. Conversely, Parkview Health Systems, Lutheran Health Network, and General Motors are among the largest employers in Fort Wayne.
There were 376 building permits issued in Washington in 2012 (149 more than in 2011) compared to 8 building permits issued in Fort Wayne in 2012 (8 more than in 2011).
In Washington (District of Columbia), 90.9% voted for Democrats and 7.3% for Republicans in 2012 Presidential Election. In Fort Wayne (Allen County), 40.9% voted for Democrats and 57.6% for Republicans.
Elections
Type
Democrats
Republicans
Other
Year
Washington
Fort Wayne
Washington
Fort Wayne
Washington
Fort Wayne
2020
92.6%
43.3%
5.4%
54.5%
2.0%
2.2%
2016
90.9%
37.3%
4.1%
56.6%
5.0%
6.1%
2012
90.9%
40.9%
7.3%
57.6%
1.8%
1.5%
2008
92.5%
47.5%
6.5%
51.8%
1.0%
0.7%
2004
89.6%
36.1%
9.4%
63.4%
1.0%
0.6%
2000
85.2%
36.4%
9.0%
61.6%
5.9%
2.0%
1996
85.2%
37.8%
9.3%
54.1%
5.5%
8.0%
Breakdown of population affiliated with a religious congregation
Type
Adherents
Congregations
Religion
Washington
Fort Wayne
Washington
Fort Wayne
CATHOLIC CHURCH
12.6%
16.0%
7.4%
5.6%
AMERICAN BAPTIST CHURCHES IN THE USA
6.2%
1.1%
10.3%
2.0%
SOUTHERN BAPTIST CONVENTION
4.4%
1.2%
10.3%
3.8%
EPISCOPAL CHURCH
3.1%
0.2%
5.3%
0.8%
SEVENTH DAY ADVENTIST CHURCH
0.9%
0.2%
1.8%
0.8%
MUSLIM ESTIMATE
0.7%
0.3%
1.1%
0.5%
EVANGELICAL LUTHERAN CHURCH IN AMERICA
0.5%
2.3%
2.1%
3.5%
LUTHERAN CHURCH
0.1%
6.8%
0.3%
8.9%
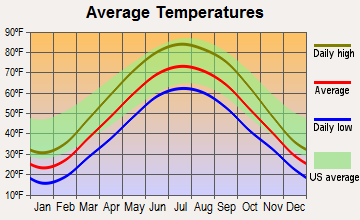
Weather
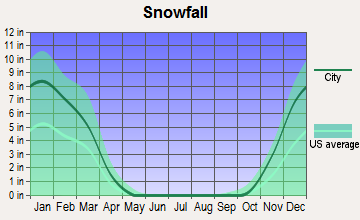
Washington, DC experiences a humid subtropical climate marked by hot, humid summers and mild to cool winters. It can be prone to multiseasonal extreme weather, including snowstorms and humidity. Fort Wayne, on the other hand, has a typical midwestern climate with hot, humid summers and very cold winters, featuring regular snowfall.
Weather and climate
Type
Washington
Fort Wayne
Temperature - Average
56.4°F
49.9°F
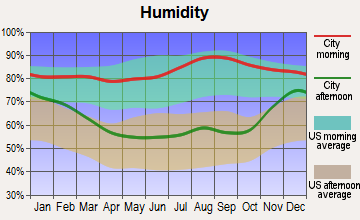
Humidity - Average morning or afternoon humidity
68.8%
77.5%
Humidity - Differences between morning and afternoon humidity
33%
33%
Humidity - Maximum monthly morning or afternoon humidity
81%
87%
Humidity - Minimum monthly morning or afternoon humidity
48%
54%
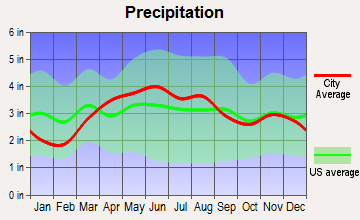
Precipitation - Yearly average
42.7 in
36.5 in
Snowfall - Yearly average
32.4 in
64.8 in
Clouds - Number of days clear of clouds
15.9%
13.1%
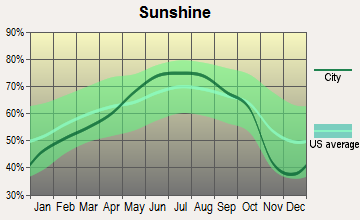
Sunshine amount - Average
61.5%
65.2%
Sunshine amount - Differences during a year
21%
40%
Sunshine amount - Maximum monthly
66%
76%
Sunshine amount - Minimum monthly
45%
36%
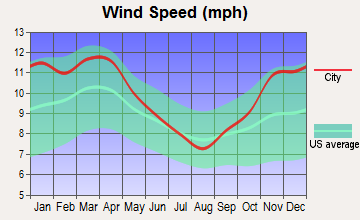
Wind speed - Average
9.7 mph
9.9 mph
Average climate in Washington, District of Columbia
Average climate in Fort Wayne, Indiana
Air pollution
Type
AQI
CO
NO2
OZONE
PB
PM10
PM25
SO2
Year
Washington
Fort Wayne
Washington
Fort Wayne
Washington
Washington
Fort Wayne
Washington
Washington
Washington
Fort Wayne
Washington
2018
88
74
0.32
N/A
11.6
N/A
23.2
27.2
N/A
N/A
16.4
N/A
8.8
8.8
0.8
N/A
2017
84
68
0.32
N/A
12.3
N/A
24.9
28.3
N/A
N/A
16.5
N/A
9.8
8.2
1.0
N/A
2016
98
78
0.43
N/A
14.7
N/A
24.6
N/A
0.002
N/A
17.2
N/A
9.5
8.8
1.0
N/A
2015
91
85
0.34
N/A
14.8
N/A
26.2
N/A
0.002
N/A
17.0
N/A
10.4
10.8
1.3
N/A
2014
85
93
0.33
N/A
11.6
N/A
25.9
N/A
0.002
N/A
17.1
N/A
10.0
13.1
1.0
N/A
2013
88
74
0.34
0.45
11.7
N/A
25.6
N/A
0.002
N/A
17.3
N/A
11.6
9.9
1.0
N/A
2012
103
91
0.58
0.64
15.2
N/A
27.6
N/A
0.002
N/A
N/A
N/A
12.2
13.9
1.6
N/A
2011
105
87
0.67
0.37
15.4
N/A
27.7
N/A
0.002
N/A
N/A
N/A
11.4
12.2
3.1
N/A
2010
114
98
0.88
0.34
15.9
N/A
29.3
N/A
0.003
N/A
N/A
N/A
9.3
15.8
3.4
N/A
2009
90
96
0.86
0.62
16.2
N/A
24.4
N/A
0.002
N/A
N/A
N/A
7.6
16.5
4.6
N/A
2008
103
96
1.23
0.79
16.2
N/A
25.3
N/A
0.003
N/A
N/A
N/A
8.5
15.7
5.6
N/A
2007
113
103
1.17
0.47
16.8
N/A
27.1
N/A
0.004
N/A
N/A
N/A
10.4
13.4
5.1
N/A
2006
114
81
1.11
0.61
17.2
N/A
25.5
N/A
0.004
N/A
N/A
N/A
10.9
11.8
4.5
N/A
2005
105
107
0.86
0.67
20.5
N/A
22.7
N/A
0.006
N/A
N/A
N/A
11.7
14.4
4.5
N/A
2004
113
75
0.62
0.85
21.3
N/A
20.6
N/A
0.004
N/A
N/A
N/A
11.3
N/A
6.5
N/A
2003
108
101
0.90
0.70
23.6
N/A
20.8
N/A
N/A
N/A
N/A
N/A
12.2
12.2
8.3
N/A
2002
125
101
1.16
0.71
23.7
N/A
25.0
N/A
N/A
N/A
N/A
N/A
N/A
13.2
6.7
N/A
2001
113
65
1.07
0.65
23.9
N/A
22.0
N/A
0.017
N/A
N/A
N/A
N/A
N/A
6.7
N/A
2000
115
73
1.17
0.83
20.2
N/A
19.1
N/A
N/A
N/A
N/A
N/A
N/A
N/A
8.2
N/A
Natural disasters
Type
Washington
Fort Wayne
Tornado activity compared to U.S. average
110.6%
174.8%
Earthquake activity compared to U.S. average
42.9%
101.2%
Natural disasters compared to U.S. average
19%
14%
Transportation
DC's well-established public transit system, including the Metrorail and Metrobus, is often seen as superior and more comprehensive than Fort Wayne's public transit options, which are mainly limited to the bus system.
Transport
Type
Washington
Fort Wayne
Amtrak stations
1
0
Amtrak stations nearby
3
0
FAA registered aircraft
456
209
FAA registered aircraft manufacturers and dealers
3
1
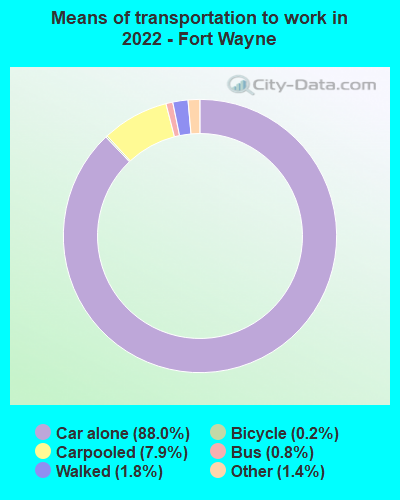
Means of transportation to work
Type
Washington
Fort Wayne
Bicycle
2%
0.4%
Bus
6.3%
0.4%
Carpooled
7.8%
7.4%
Car alone
62.5%
89.6%
Railroad
0.3%
0%
Streetcar
10.6%
0%
Subway
1.3%
0%
Taxicab
0.8%
0%
Walked
5.7%
1.4%
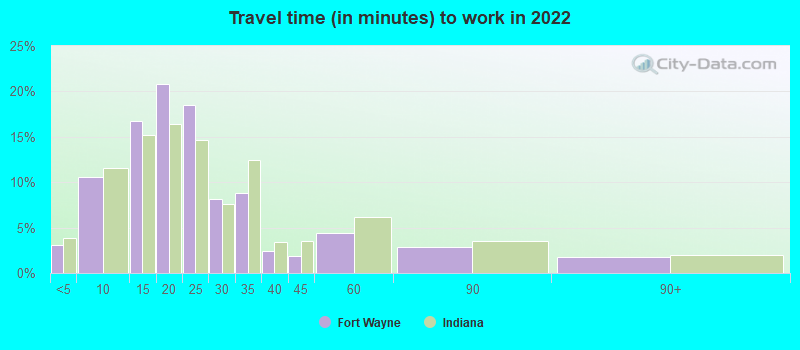
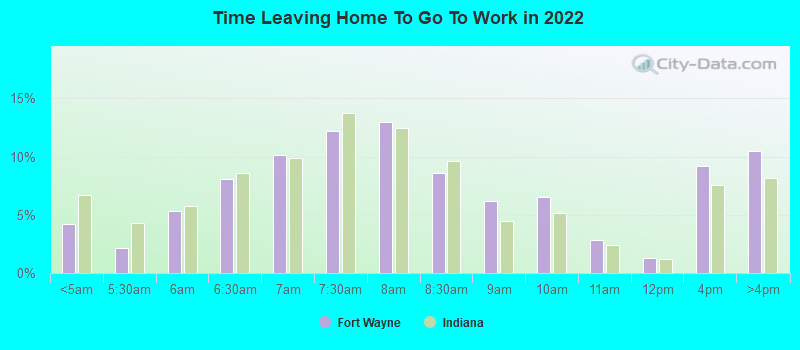
Average travel time to work
Type
Washington
Fort Wayne
Average
39.2 min
23.9 min
Other means
26 min
20.5 min
Public transportation
38.9 min
38.1 min
Private vehicle occupancy
Type
Washington
Fort Wayne
Average
1.1
1.1
Drove alone
89.4%
91.1%
In 2 person carpool
9.7%
7.4%
In 3 person carpool
0.6%
0.4%
In 4 person carpool
0.4%
0.3%
In 5-6 person carpool
0%
0.6%
In 7+ person carpool
0%
0.2%
How many people usually rode to work in the car, truck or van.
Real Estate
Real estate prices in Washington, DC are significantly higher than Fort Wayne, since DC's market caters mostly to high-income buyers. Meanwhile, Fort Wayne represents one of the most affordable markets in the country.
Neighborhoods
Both cities have unique neighborhoods to explore. DC's neighborhoods each offer distinctive cultural experiences, from the historic charm of Georgetown to the eclectic vibe of Adams Morgan. Fort Wayne's neighborhoods have their charm as well, reflecting the city's historic and cultural diversity.
Houses and residents
Type
Washington
Fort Wayne
Houses
357,482
117,245
Average household size (people)
2.1
2.4
Median year apartment built
1965
1976
Median year house/condo built
1941
1972
Length of stay in the house since moving in
13.5 years
12.2 years
Houses occupied
319,565 (89.4%)
109,640 (93.5%)
Houses occupied by owners
132,936 (41.6%)
68,004 (62%)
Houses occupied by renters
186,629 (58.4%)
41,636 (38%)
Median rent asked for vacant for-rent units
$2,791
$729.05
Median monthly housing costs
$1,817
$844
Median price asked for vacant for-sale houses and condos
$996,150
$135,711
Estimated median house or condo value
$669,900
$155,600
Median numbers of rooms
3.8
5.9
Median number of rooms in apartments
3.1
4.2
Median number of rooms in houses and condos
6
6.8
Median house price - detached houses
Over $1,000,000
$167,457
Median house price - in 2-unit structures
Over $1,000,000
$66,481
Median house price - in 3-to-4-unit structures
$471,443
$136,033
Median house price - in 5 or more unit structures
$527,983
$154,215
Median house price - Townhouses or other attached units
$817,288
$138,742
Median house price - All housing units
$790,542
$164,476
Median house age
65
48
Renting percentage
58%
36.7%
Housing density (houses/condos per square mile)
5,821.9
1,485
House value disparities
26.7%
31.9%
Household income disparities
45.7%
42.5%
Median household income for houses/condes with a mortgage
$163,111
$72,350
Median household income for apartments without a mortgage
$108,852
$59,128
Housing units without a mortgage
777 (0.8%)
811 (1.8%)
Housing units with both a second mortgage and home equity loan
8,586 (8.5%)
3,282 (7.3%)
Housing units with a mortgage
100,122 (99.2%)
43,922 (98.2%)
Housing units with a home equity loan
1,057 (1%)
0 (0%)
Housing units with a second mortgage
12,793 (12.7%)
3,996 (8.9%)
House/condo owner moved in on average (years ago)
10
10
House/condo renter moved in on average (years ago)
1
1
Housing units lacking complete kitchen facilities
1.5%
1%
Housing units lacking complete plumbing facilities
1.5%
0.5%
Housing units in structures
Housing units in structures
Washington
Fort Wayne
One, detached
11.2%
69.2%
One, attached
22.2%
2.6%
Two
2.7%
2.4%
3 or 4
6.8%
5.3%
5 to 9
7.3%
6.3%
10 to 19
8.5%
5.6%
20 to 49
7.6%
2.8%
50 or more
33.6%
3.7%
Mobile homes
0.2%
2.1%
Median real estate property taxes paid for housing units
Self-employed workers in own not incorporated business
16,654
6,040
State government workers
6,699
2,352
Unpaid family workers
580
430
Industries and Occupations
While public administration, professional services, and education dominate DC's job market, Fort Wayne is known for its manufacturing industry as well as health care, retail, and a rising tech sector.
Both cities have strong health care systems. Washington, DC, hosts several renowned hospitals, and Fort Wayne's healthcare meets the expected standards of a smaller metropolis, with well-regarded local hospitals serving the community.
Health (county statistics)
Type
Washington
Fort Wayne
General health status score of residents in this county from 1 (poor) to 5 (excellent)
DC's infrastructure suits its status as a global city, with modern buildings and facilities, including multiple airports, rail systems, and highways. Meanwhile, Fort Wayne upholds a comprehensive infrastructure with everything needed to support a smaller city, including an airport, roads, parks, and recreational facilities.
Infrastructure
Type
Washington
Fort Wayne
Hospitals
114
21
TV stations
27
11
Arenas or stadiums
4
1
Bank branches located here
247
93
Bank institutions located here
34
20
Main business address for public companies
30
3
Drinking water stations with no reported violations in the past
5
1
Drinking water stations with reported violations in the past
HMDA - Conventional home purchase loans - Applications denied
Year
Washington
Fort Wayne
1999
1,328
1,000
2000
1,438
865
2001
935
592
2002
886
355
2003
1,319
476
2004
2,281
748
2005
2,920
940
2006
3,362
1,055
2007
2,548
614
2008
1,095
234
2009
514
113
Culture and Food
Culturally and gastronomically, DC stands out with its global cuisine, national monuments, and myriad of museums. Fort Wayne, while smaller, boasts local eateries offering Midwest fare and a commitment to arts and culture, including vibrant music and art scenes.
Sports Teams
In terms of professional sports, Washington, DC, is home to multiple teams across different leagues, such as the Washington Nationals (MLB), Washington Capitals (NHL), and Washington Football Team (NFL). In Fort Wayne, the Komets (ECHL) and TinCaps (Professional Baseball) satiate local fans' sporting interests.


 Washington, DC
 Fort Wayne, IN