Adelanto: Fire Incidents, California (CA)
Where are fire incidents reported in Adelanto, CA
Something went wrong! Please refresh the page.
|
| |||||||||||||||||||||||||||||||||||||||||||||||||||||||||||||||||||||||||||||||||||||||||||||||||||||||||||||
2006 - 2018 National Fire Incident Reporting System (NFIRS) incidents
- Incident types reported to NFIRS in Adelanto, CA
- 5,43567.8%Rescue & EMS
- 1,77622.2%Good Intent Call
- 2923.6%Fire
- 2322.9%Service Call
- 1892.4%False Alarm
- 861.1%Hazardous Condition
- Fire incident types reported to NFIRS in Adelanto, CA
- 12141.4%Structure Fires
- 11238.4%Outside Fires
- 5017.1%Mobile Property/Vehicle Fires
- 93.1%Other
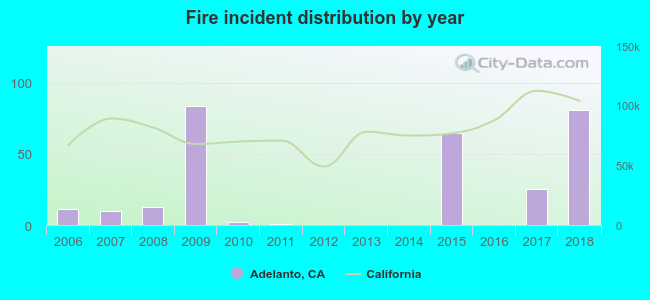 Based on the data from the years 2006 - 2018 the average number of fire incidents per year is 22. The highest number of reported fires - 84 took place in 2009, and the least - 0 in 2012. The data has a rising trend.
The average number of yearly fire incidents per 10k residents in Adelanto, CA compared to nearest cities:
(Note: Based on data for the last 3 years, including only cities with population 5,000 and above)
| Adelanto: | 16.2 |
| Victorville: | 11.2 |
| Spring Valley Lake: | 4.1 |
| Oak Hills: | 2.8 |
| Phelan: | 32.6 |
| Apple Valley: | 8.1 |
| Hesperia: | 10.4 |
| Pinon Hills: | 11.0 |
| Lake Los Angeles: | 46.5 |

 31.8% incidents where reported in the morning and 68.2% in the evening. The most fires (17.8%) took place on Monday, and the least (11.6%) on Wednesday.
 According to the 292 fires from years 2006 - 2018 most fires (11.3%) took place during February, and the least (6.2%) in August.
 Out of all 8,015 cases reported during the years 2006 - 2018, the most belonged to the categories: Rescue & EMS (67.8%), Good Intent Call (22.2%), and Fire (3.6%).
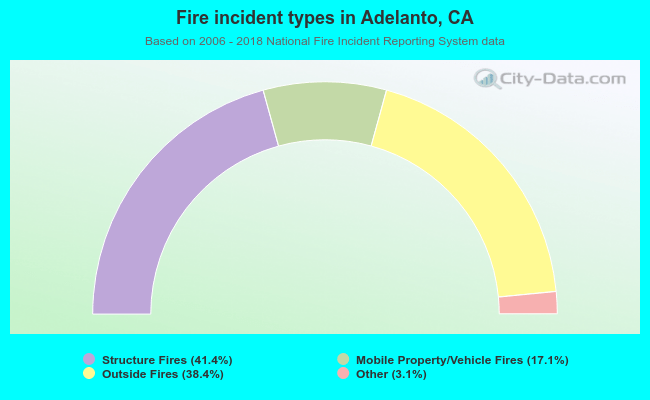 When looking into fire subcategories, the most incidents belonged to: Structure Fires (41.4%), and Outside Fires (38.4%).