Apple Valley: Fire Incidents, California (CA)
Where are fire incidents reported in Apple Valley, CA
Something went wrong! Please refresh the page.
| Fire incidents reported | |
|---|---|
| Sreet name | Count |
| BEAR VALLEY RD | 104 |
| NAVAJO RD | 76 |
| STATE HWY | 68 |
| APPLE VALLEY RD | 54 |
| CENTRAL RD | 42 |
| KIOWA RD | 42 |
| RANCHERIAS RD | 42 |
| STATE 18 HWY | 42 |
| 18 HWY | 40 |
| DALE EVANS PKY | 38 |
| WAALEW RD | 38 |
| RIMROCK RD | 32 |
| THUNDERBIRD RD | 32 |
| ZUNI RD | 32 |
| OTTAWA RD | 28 |
| SERRANO RD | 28 |
| QUINNAULT RD | 26 |
| STANDING ROCK AVE | 26 |
| MOHAWK RD | 22 |
| SITTING BULL RD | 22 |
| HIGHWAY 18 | 20 |
| STODDARD WELLS RD | 20 |
| YUCCA LOMA RD | 20 |
| KIAMICHI RD | 18 |
| NISQUALLY RD | 18 |
| RAMONA AVE | 18 |
| TONEKAI RD | 18 |
| BROKEN BOW RD | 16 |
| JOHNSON RD | 16 |
| MILPAS DR | 16 |
| Other | 264 |
2005 - 2018 National Fire Incident Reporting System (NFIRS) incidents
- Incident types reported to NFIRS in Apple Valley, CA
- 12,37868.4%Rescue & EMS
- 1,7329.6%Service Call
- 1,6038.9%Good Intent Call
- 1,2787.1%Fire
- 6163.4%Hazardous Condition
- 3321.8%False Alarm
- 1410.8%Special Incident
- Fire incident types reported to NFIRS in Apple Valley, CA
- 64250.2%Outside Fires
- 37629.4%Structure Fires
- 23118.1%Mobile Property/Vehicle Fires
- 292.3%Other
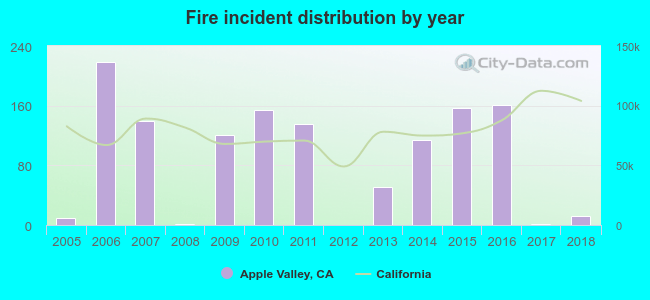 According to the data from the years 2005 - 2018 the average number of fire incidents per year is 91. The highest number of reported fires - 219 took place in 2006, and the least - 0 in 2012. The data has an increasing trend.
The average number of yearly fire incidents per 10k residents in Apple Valley, CA compared to nearest cities:
(Note: Based on data for the last 3 years, including only cities with population 5,000 and above)
| Apple Valley: | 8.1 |
| Spring Valley Lake: | 4.1 |
| Victorville: | 11.2 |
| Hesperia: | 10.4 |
| Adelanto: | 16.2 |
| Oak Hills: | 2.8 |
| Lucerne Valley: | 30.4 |
| Lake Arrowhead: | 6.7 |
| Crestline: | 13.3 |
 The median response time based on all reported fire incidents is 7 minutes. This is comparable to the state median value.
The median response time in Apple Valley, CA compared to nearest cities:
(Note: Based on data for all years, including only cities with at least 500 fire incidents)
| Apple Valley: | 7 minutes |
| Victorville: | 7 minutes |
| Hesperia: | 8 minutes |
| San Bernardino: | 7 minutes |
| Rialto: | 8 minutes |
| Colton: | 7 minutes |
| Redlands: | 6 minutes |
| Fontana: | 7 minutes |
| Loma Linda: | 6 minutes |
 According to the data from the years 2005 - 2018 the average number of fire-related yearly deaths is 0. The highest number of reported deaths - 1 took place in 2011, and the lowest - 0 in 2005. The data has a constant trend.
 32.2% incidents where reported in the morning and 67.8% in the evening. The most fires (16.6%) took place on Saturday, and the least (12.7%) on Wednesday.
 Based on the 1,278 fires from years 2005 - 2018 most fires (13.8%) took place during June, and the least (4.9%) in December.
 Out of all 18,086 cases reported during the years 2005 - 2018, the most belonged to the categories: Rescue & EMS (68.4%), Service Call (9.6%), and Good Intent Call (8.9%).
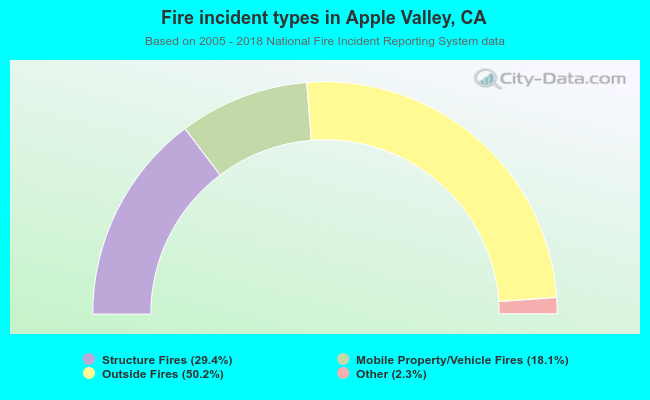 When looking into fire subcategories, the most reports belonged to: Outside Fires (50.2%), and Structure Fires (29.4%).