Ansonia: Fire Incidents, Connecticut (CT)
Where are fire incidents reported in Ansonia, CT
Something went wrong! Please refresh the page.
| Fire incidents reported | |
|---|---|
| Sreet name | Count |
| MAIN ST | 342 |
| WOODLAWN AVE | 230 |
| WAKELEE AVE | 116 |
| OLSON DR | 78 |
| HOWARD AVE | 76 |
| BEAVER ST | 62 |
| STATE ST | 62 |
| WOODBRIDGE AVE | 62 |
| FOURTH ST | 60 |
| CLIFF ST | 54 |
| PERSHING DR | 50 |
| DIVISION ST | 46 |
| PULASKI HWY | 42 |
| JEWETT ST | 38 |
| LESTER ST | 34 |
| PRINDLE AVE | 34 |
| GROVE ST | 32 |
| ROUTE CONN 8 | 32 |
| FRANKLIN ST | 28 |
| PLATT ST | 28 |
| CENTRAL ST | 26 |
| CLIFTON AVE | 26 |
| DIVISION | 26 |
| HODGE AVE | 26 |
| LIBERTY ST | 26 |
| SPRING ST | 24 |
| WESTFIELD AVE | 24 |
| FIFTH ST | 22 |
| HULL ST | 22 |
| PROSPECT ST | 22 |
2002 - 2018 National Fire Incident Reporting System (NFIRS) incidents
- Incident types reported to NFIRS in Ansonia, CT
- 2,66443.1%Hazardous Condition
- 1,47723.9%Fire
- 95015.4%False Alarm
- 3876.3%Service Call
- 3335.4%Good Intent Call
- 3225.2%Rescue & EMS
- 250.4%Severe Weather
- 160.3%Special Incident
- 80.1%Overpressure Rupture
- Fire incident types reported to NFIRS in Ansonia, CT
- 82555.9%Structure Fires
- 46031.1%Outside Fires
- 17411.8%Mobile Property/Vehicle Fires
- 181.2%Other
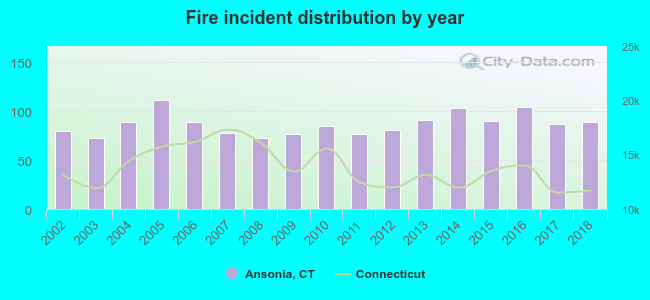 According to the data from the years 2002 - 2018 the average number of fire incidents per year is 87. The highest number of reported fire incidents - 111 took place in 2005, and the least - 73 in 2003. The data has a growing trend.
The average number of yearly fire incidents per 10k residents in Ansonia, CT compared to nearest cities:
(Note: Based on data for the last 3 years, including only cities with population 5,000 and above)
| Ansonia: | 49.2 |
| Derby: | 47.0 |
| Seymour: | 29.4 |
| Woodbridge: | 51.2 |
| Shelton: | 16.1 |
| Orange: | 34.2 |
| Riverside: | 18.6 |
| Bethany: | 11.4 |
| Oxford: | 26.3 |
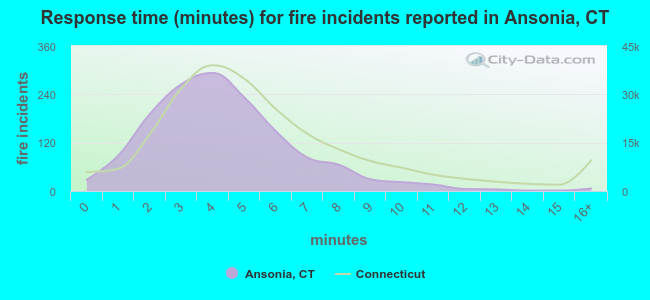 The median response time based on all reported fire incidents is 4 minutes. This is lower compared to the state median value.
The median response time in Ansonia, CT compared to nearest cities:
(Note: Based on data for all years, including only cities with at least 500 fire incidents)
| Ansonia: | 4 minutes |
| Derby: | 3 minutes |
| Seymour: | 5 minutes |
| Shelton: | 7 minutes |
| Orange: | 5 minutes |
| Oxford: | 6 minutes |
| West Haven: | 4 minutes |
| Monroe: | 6 minutes |
| New Haven: | 4 minutes |
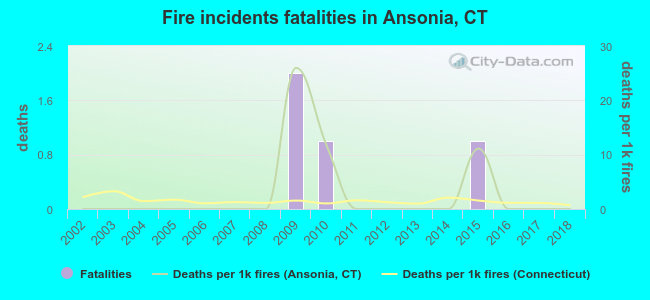 Based on the data from the years 2002 - 2018 the average number of fire-related fatalities per year is 0. The highest number of deaths - 2 took place in 2009, and the lowest - 0 in 2002. The data has a constant trend.
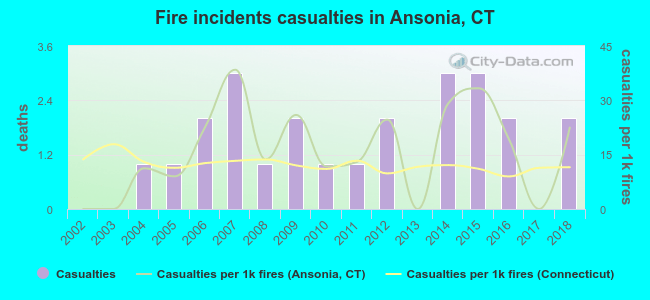 According to the reports from the years 2002 - 2018 the average number of fire-related yearly casualties is 1. The highest number of casualties - 3 took place in 2007, and the lowest - 0 in 2002. The data has an increasing trend.
The average number of casualties per 1,000 fires is 16. This indicator was the highest - 38 in 2007, and the lowest 0 in 2002. The trend for injuries per 1,000 fire incidents is increasing. Compared to the state value the number of injuries per 1,000 fire incidents is higher.
According to the reports from the years 2002 - 2018 the average number of fire-related yearly casualties is 1. The highest number of casualties - 3 took place in 2007, and the lowest - 0 in 2002. The data has an increasing trend.
The average number of casualties per 1,000 fires is 16. This indicator was the highest - 38 in 2007, and the lowest 0 in 2002. The trend for injuries per 1,000 fire incidents is increasing. Compared to the state value the number of injuries per 1,000 fire incidents is higher.
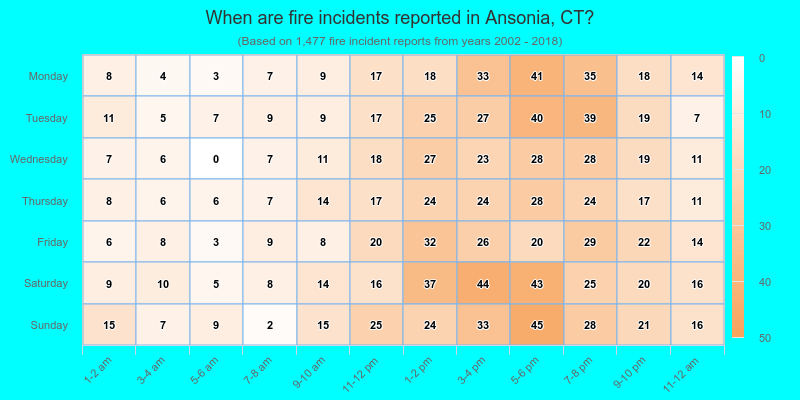
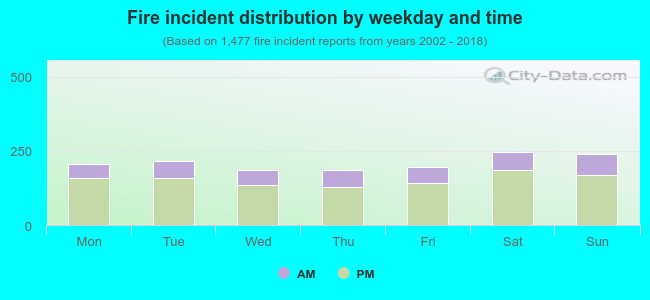 27.2% incidents where reported in the morning and 72.8% in the evening. The most fires (16.7%) took place on Saturday, and the least (12.5%) on Wednesday.
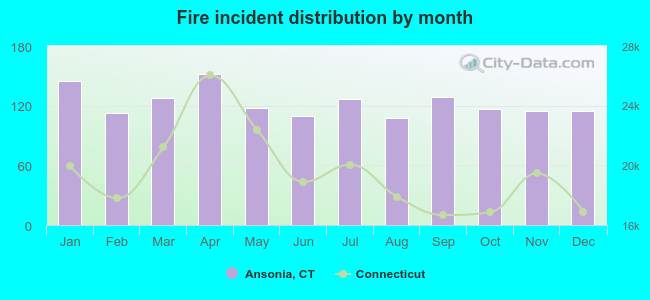 Based on the 1,477 fire incidents from years 2002 - 2018 most fires (10.3%) took place during April, and the least (7.3%) in August.
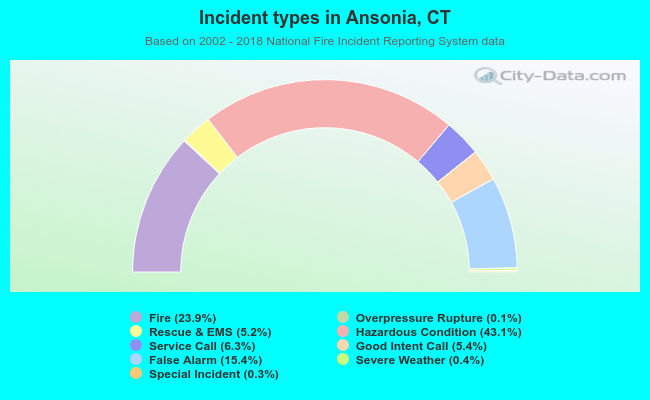 Out of all 6,182 cases reported during the years 2002 - 2018, the most belonged to the categories: Hazardous Condition (43.1%), Fire (23.9%), and False Alarm (15.4%).
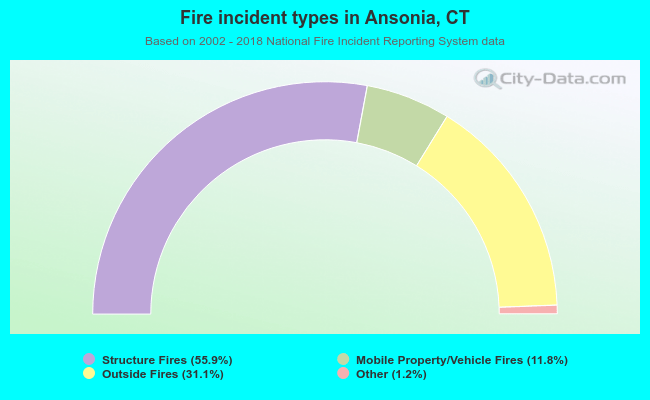 When looking into fire subcategories, the most reports belonged to: Structure Fires (55.9%), and Outside Fires (31.1%).