Orange: Fire Incidents, Connecticut (CT)
Where are fire incidents reported in Orange, CT
Something went wrong! Please refresh the page.
| Fire incidents reported | |
|---|---|
| Sreet name | Count |
| BOSTON POST RD | 400 |
| INDIAN RIVER RD | 108 |
| DERBY AVE | 88 |
| GRASSY HILL RD | 64 |
| RACEBROOK RD | 62 |
| DERBY MILFORD RD | 60 |
| MERRITT PKY | 58 |
| INTERSTATE 95 EXPY | 56 |
| ORANGE CENTER RD | 46 |
| MARSH HILL RD | 36 |
| RIDGE RD | 32 |
| EDISON RD | 30 |
| LAMBERT RD | 30 |
| DERBY TPKE | 28 |
| BOSTON POST ROAD | 26 |
| BULL HILL LN | 18 |
| DOGWOOD RD | 18 |
| MAPLEDALE RD | 18 |
| OLD TAVERN RD | 18 |
| BULL HILL LA | 16 |
| ROUTE 15 | 14 |
| DOGBURN RD | 12 |
| PINE TREE DR | 12 |
| PRINDLE HILL RD | 12 |
| WHEELERS FARMS RD | 12 |
| CONNECTICUT TPKE | 10 |
| GARDEN RD | 10 |
| TURKEY HILL RD | 10 |
| ALLING RD | 8 |
| CARLSON RD | 8 |
2002 - 2018 National Fire Incident Reporting System (NFIRS) incidents
- Incident types reported to NFIRS in Orange, CT
- 1,58237.0%Hazardous Condition
- 1,17127.4%False Alarm
- 97922.9%Fire
- 2285.3%Service Call
- 1734.0%Good Intent Call
- 1152.7%Rescue & EMS
- 150.4%Overpressure Rupture
- 50.1%Special Incident
- Fire incident types reported to NFIRS in Orange, CT
- 45046.0%Outside Fires
- 25225.7%Structure Fires
- 24825.3%Mobile Property/Vehicle Fires
- 293.0%Other
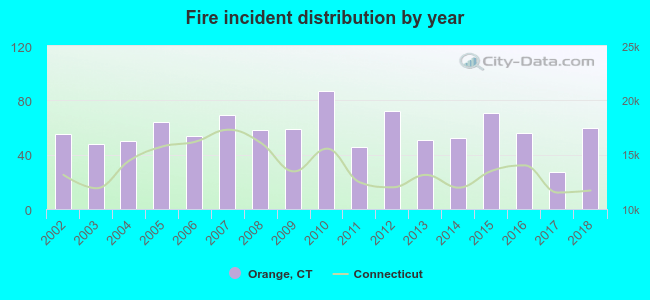 Based on the data from the years 2002 - 2018 the average number of fires per year is 58. The highest number of fires - 87 took place in 2010, and the least - 27 in 2017. The data has a growing trend.
The average number of yearly fire incidents per 10k residents in Orange, CT compared to nearest cities:
(Note: Based on data for the last 3 years, including only cities with population 5,000 and above)
| Orange: | 34.2 |
| West Haven: | 47.2 |
| Derby: | 47.0 |
| Milford: | 21.3 |
| Ansonia: | 49.2 |
| Woodbridge: | 51.2 |
| Shelton: | 16.1 |
| New Haven: | 29.0 |
| Stratford: | 32.9 |
 The median response time based on all reported fire incidents is 5 minutes. This is about the same as the state median value.
The median response time in Orange, CT compared to nearest cities:
(Note: Based on data for all years, including only cities with at least 500 fire incidents)
| Orange: | 5 minutes |
| West Haven: | 4 minutes |
| Derby: | 3 minutes |
| Milford: | 5 minutes |
| Ansonia: | 4 minutes |
| Shelton: | 7 minutes |
| New Haven: | 4 minutes |
| Stratford: | 5 minutes |
| Seymour: | 5 minutes |
 According to the reports from the years 2002 - 2018 the average number of fire-related yearly casualties is 1. The highest number of casualties - 6 took place in 2007, and the lowest - 0 in 2002. The data has a constant trend.
The average number of injuries per 1,000 fires is 13. This indicator was the highest - 87 in 2007, and the lowest 0 in 2002. The trend for casualties per 1,000 fire incidents is constant. Compared to the state value the number of casualties per 1,000 fire incidents is similar.
According to the reports from the years 2002 - 2018 the average number of fire-related yearly casualties is 1. The highest number of casualties - 6 took place in 2007, and the lowest - 0 in 2002. The data has a constant trend.
The average number of injuries per 1,000 fires is 13. This indicator was the highest - 87 in 2007, and the lowest 0 in 2002. The trend for casualties per 1,000 fire incidents is constant. Compared to the state value the number of casualties per 1,000 fire incidents is similar.
 24.1% incidents where reported in the morning and 75.9% in the evening. The most fires (17.0%) took place on Saturday, and the least (11.8%) on Monday.
 According to the 979 fires from years 2002 - 2018 most fires (11.8%) took place during April, and the least (5.9%) in October.
 Out of all 4,272 cases reported during the years 2002 - 2018, the most belonged to the categories: Hazardous Condition (37.0%), False Alarm (27.4%), and Fire (22.9%).
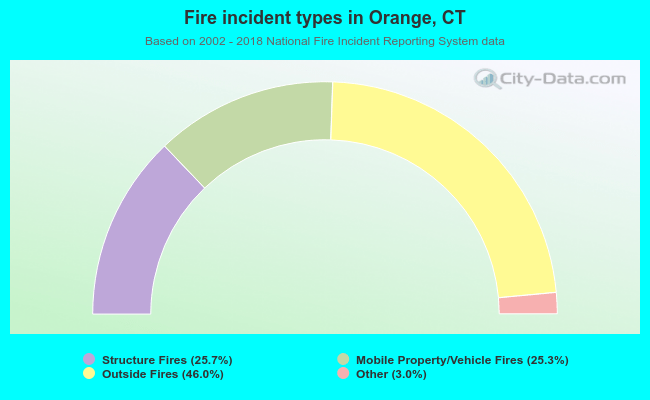 When looking into fire subcategories, the most reports belonged to: Outside Fires (46.0%), and Structure Fires (25.7%).