Bellmead: Fire Incidents, Texas (TX)
Where are fire incidents reported in Bellmead, TX
Something went wrong! Please refresh the page.
| Fire incidents reported | |
|---|---|
| Sreet name | Count |
| NEW DALLAS HWY | 72 |
| NORTH I-35 NB ACCESS RD | 64 |
| KATY LANE | 58 |
| HIGHWAY 84 | 54 |
| OLD DALLAS RD | 54 |
| OLD MEXIA RD | 52 |
| I35 NB ACCESS RD | 50 |
| NORTH I35 | 46 |
| BELLMEAD DR | 42 |
| MEYERS LANE | 36 |
| SELBY LANE | 36 |
| BEHRENS CIR | 34 |
| OLD MARLIN RD | 34 |
| BUD DR | 32 |
| SCROGGINS EVEN ST | 30 |
| NORTH I-35 NB | 26 |
| HARRISON (1900 - 3900) ST | 24 |
| JANUARY ST | 24 |
| LOOP 340 | 24 |
| MATHEWS ST | 24 |
| BELLMEAD 4100 - 4200 BLK DR | 22 |
| CONCORD 4600-5200 BLK RD | 22 |
| HIGHWAY 6 | 22 |
| MICHIGAN ST | 22 |
| BELLMEAD 4300-4900(O) DR | 20 |
| MONTROSE ST | 20 |
| SOUTH I35 | 20 |
| BOWIE ST | 18 |
| CONCORD RD | 18 |
| ELK RD. | 18 |
| Other | 569 |
2002 - 2018 National Fire Incident Reporting System (NFIRS) incidents
- Incident types reported to NFIRS in Bellmead, TX
- 5,62256.2%Rescue & EMS
- 1,58715.9%Fire
- 1,22012.2%Good Intent Call
- 9109.1%Hazardous Condition
- 3823.8%Service Call
- 2512.5%False Alarm
- 170.2%Special Incident
- Fire incident types reported to NFIRS in Bellmead, TX
- 71144.8%Outside Fires
- 51732.6%Structure Fires
- 29518.6%Mobile Property/Vehicle Fires
- 644.0%Other
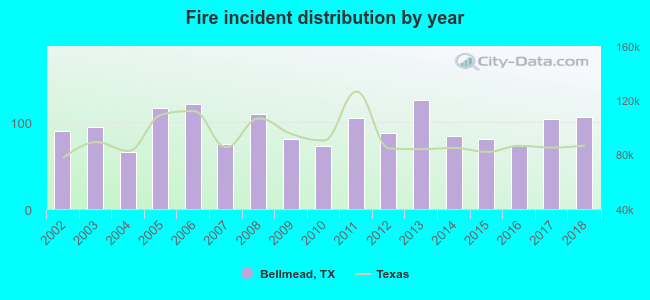 According to the data from the years 2002 - 2018 the average number of fire incidents per year is 93. The highest number of reported fire incidents - 125 took place in 2013, and the least - 66 in 2004. The data has a growing trend.
The average number of yearly fire incidents per 10k residents in Bellmead, TX compared to nearest cities:
(Note: Based on data for the last 3 years, including only cities with population 5,000 and above)
| Bellmead: | 92.3 |
| Waco: | 45.7 |
| Elm Mott: | 69.7 |
| Robinson: | 44.1 |
| Woodway: | 19.0 |
| Hewitt: | 17.6 |
| McGregor: | 8.6 |
| Marlin: | 62.7 |
| Hillsboro: | 103.8 |
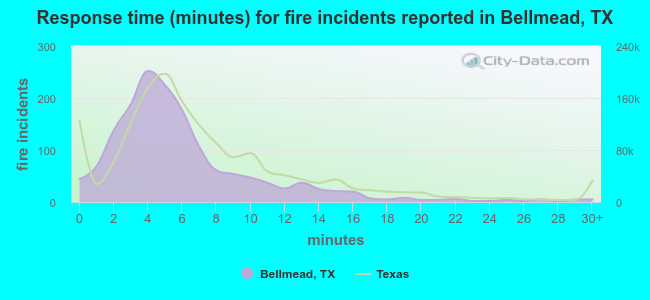 The median response time based on all reported fire incidents is 5 minutes. This is lower than the state median value.
The median response time in Bellmead, TX compared to nearest cities:
(Note: Based on data for all years, including only cities with at least 500 fire incidents)
| Bellmead: | 5 minutes |
| Waco: | 4 minutes |
| Robinson: | 9 minutes |
| Hewitt: | 7 minutes |
| West: | 5 minutes |
| Marlin: | 3 minutes |
| Whitney: | 9 minutes |
| Hillsboro: | 7 minutes |
| Groesbeck: | 12 minutes |
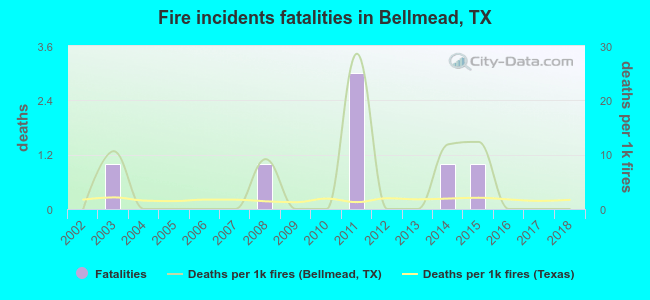 Based on the reports from the years 2002 - 2018 the average number of fire-related fatalities per year is 0. The highest number of deaths - 3 took place in 2011, and the lowest - 0 in 2002. The data has a constant trend.
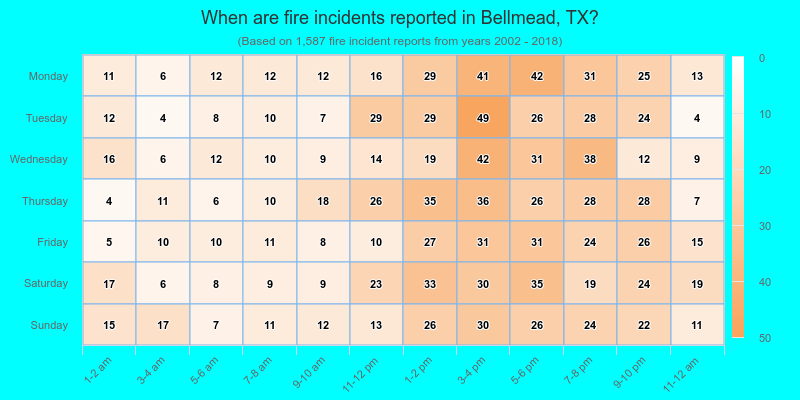
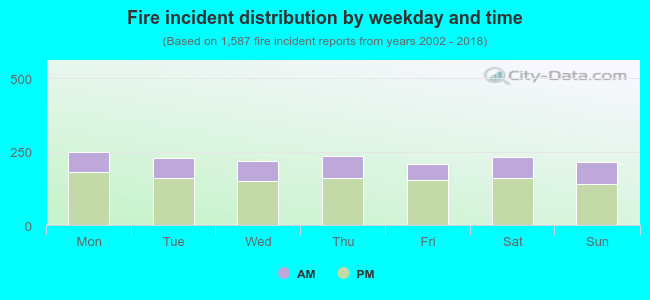 30.4% incidents where reported in the morning and 69.6% in the evening. The most fires (15.8%) took place on Monday, and the least (13.1%) on Friday.
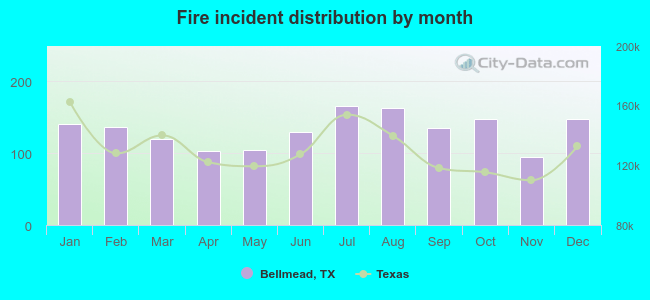 According to the 1,587 fire incidents from years 2002 - 2018 most fires (10.5%) took place during July, and the least (6.0%) in November.
 Out of all 10,002 cases reported during the years 2002 - 2018, the most belonged to the categories: Rescue & EMS (56.2%), Fire (15.9%), and Good Intent Call (12.2%).
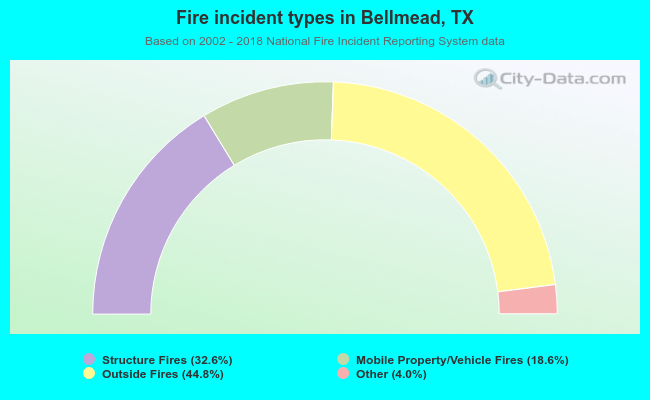 When looking into fire subcategories, the most reports belonged to: Outside Fires (44.8%), and Structure Fires (32.6%).