Elm Mott: Fire Incidents, Texas (TX)
Where are fire incidents reported in Elm Mott, TX
Something went wrong! Please refresh the page.
|
| |||||||||||||||||||||||||||||||||||||||||||||||||||||||||||||||||||||||||||||||||||||||||||||||||||||||||||||
| Other | 55 | |||||||||||||||||||||||||||||||||||||||||||||||||||||||||||||||||||||||||||||||||||||||||||||||||||||||||||||
2002 - 2018 National Fire Incident Reporting System (NFIRS) incidents
- Incident types reported to NFIRS in Elm Mott, TX
- 65552.6%Rescue & EMS
- 37730.3%Fire
- 1229.8%Good Intent Call
- 554.4%Hazardous Condition
- 282.2%Service Call
- 70.6%False Alarm
- Fire incident types reported to NFIRS in Elm Mott, TX
- 16142.7%Outside Fires
- 15039.8%Structure Fires
- 6015.9%Mobile Property/Vehicle Fires
- 61.6%Other
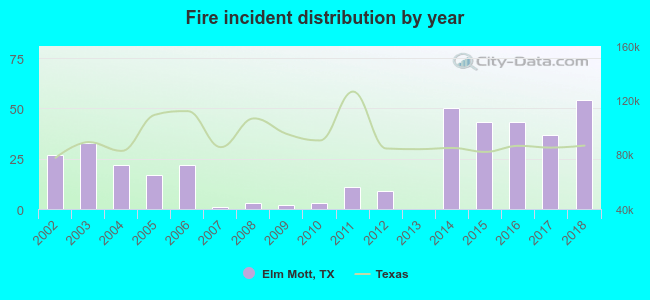 Based on the data from the years 2002 - 2018 the average number of fire incidents per year is 22. The highest number of fires - 54 took place in 2018, and the least - 0 in 2013. The data has a growing trend.
The average number of yearly fire incidents per 10k residents in Elm Mott, TX compared to nearest cities:
(Note: Based on data for the last 3 years, including only cities with population 5,000 and above)
| Elm Mott: | 69.7 |
| Bellmead: | 92.3 |
| Waco: | 45.7 |
| Woodway: | 19.0 |
| Robinson: | 44.1 |
| Hewitt: | 17.6 |
| Hillsboro: | 103.8 |
| McGregor: | 8.6 |
| Marlin: | 62.7 |

 22.3% incidents where reported in the morning and 77.7% in the evening. The most fires (17.8%) took place on Wednesday, and the least (8.5%) on Thursday.
 Based on the 377 fire incidents from years 2002 - 2018 most fires (11.4%) took place during July, and the least (4.8%) in November.
 Out of all 1,246 cases reported during the years 2002 - 2018, the most belonged to the categories: Overpressure Rupture (52.6%), Fire (30.3%), and Service Call (9.8%).
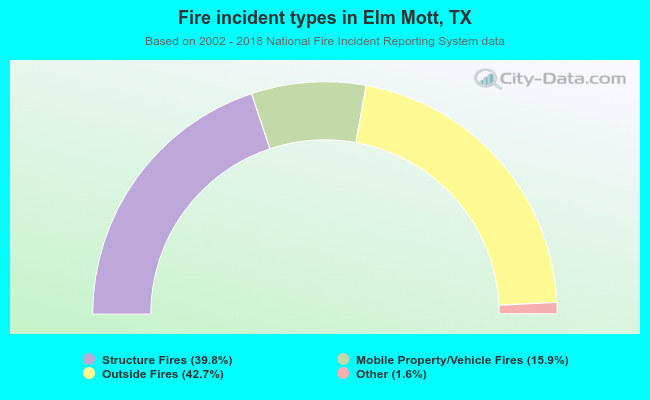 When looking into fire subcategories, the most reports belonged to: Outside Fires (42.7%), and Structure Fires (39.8%).