Robinson: Fire Incidents, Texas (TX)
Where are fire incidents reported in Robinson, TX
Something went wrong! Please refresh the page.
|
| |||||||||||||||||||||||||||||||||||||||||||||||||||||||||||||||||||||||||||||||||||||||||||||||||||||||||||||
2002 - 2018 National Fire Incident Reporting System (NFIRS) incidents
- Incident types reported to NFIRS in Robinson, TX
- 1,74156.0%Rescue & EMS
- 56118.1%Fire
- 2949.5%Good Intent Call
- 2758.8%Hazardous Condition
- 1314.2%Service Call
- 902.9%False Alarm
- 90.3%Overpressure Rupture
- 40.1%Special Incident
- Fire incident types reported to NFIRS in Robinson, TX
- 29552.6%Outside Fires
- 13724.4%Structure Fires
- 11119.8%Mobile Property/Vehicle Fires
- 183.2%Other
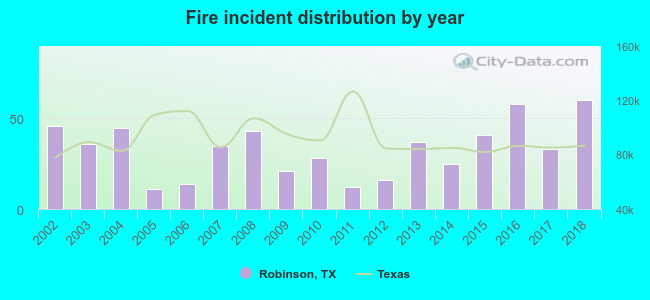 According to the data from the years 2002 - 2018 the average number of fires per year is 33. The highest number of reported fire incidents - 60 took place in 2018, and the least - 11 in 2005. The data has an increasing trend.
The average number of yearly fire incidents per 10k residents in Robinson, TX compared to nearest cities:
(Note: Based on data for the last 3 years, including only cities with population 5,000 and above)
| Robinson: | 44.1 |
| Hewitt: | 17.6 |
| Waco: | 45.7 |
| Woodway: | 19.0 |
| Bellmead: | 92.3 |
| Elm Mott: | 69.7 |
| Marlin: | 62.7 |
| McGregor: | 8.6 |
| Temple: | 47.9 |
 The median response time based on all reported fire incidents is 9 minutes. This is higher compared to the Texas median value.
The median response time in Robinson, TX compared to nearest cities:
(Note: Based on data for all years, including only cities with at least 500 fire incidents)
| Robinson: | 9 minutes |
| Hewitt: | 7 minutes |
| Waco: | 4 minutes |
| Bellmead: | 5 minutes |
| Marlin: | 3 minutes |
| West: | 5 minutes |
| Temple: | 6 minutes |
| Bremond: | 10 minutes |
| Groesbeck: | 12 minutes |
 24.8% incidents where reported in the morning and 75.2% in the evening. The most fires (17.3%) took place on Tuesday, and the least (12.1%) on Sunday.
 According to the 561 fire incidents from years 2002 - 2018 most fires (14.1%) took place during July, and the least (4.6%) in November.
 Out of all 3,108 cases reported during the years 2002 - 2018, the most belonged to the categories: Rescue & EMS (56.0%), Fire (18.1%), and Good Intent Call (9.5%).
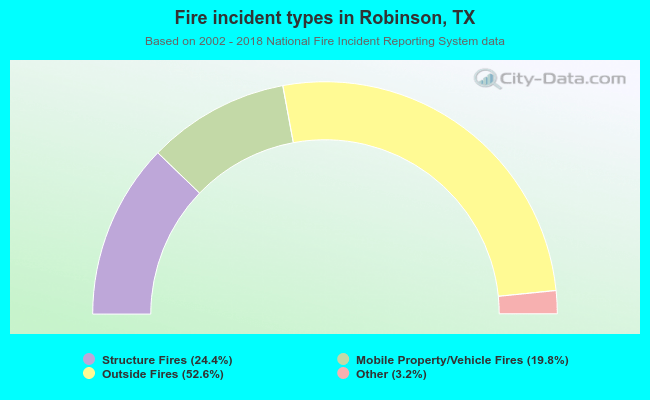 When looking into fire subcategories, the most incidents belonged to: Outside Fires (52.6%), and Structure Fires (24.4%).