Burton: Fire Incidents, South Carolina (SC)
Where are fire incidents reported in Burton, SC
Something went wrong! Please refresh the page.
|
| |||||||||||||||||||||||||||||||||||||||||||||||||||||||||||||||||||||||||||||||||||||||||||||||||||||||||||||
2004 - 2018 National Fire Incident Reporting System (NFIRS) incidents
- Incident types reported to NFIRS in Burton, SC
- 93247.3%Rescue & EMS
- 27614.0%Fire
- 27213.8%Good Intent Call
- 25513.0%Service Call
- 1145.8%False Alarm
- 1115.6%Hazardous Condition
- 60.3%Special Incident
- 30.2%Overpressure Rupture
- Fire incident types reported to NFIRS in Burton, SC
- 12846.4%Outside Fires
- 10538.0%Structure Fires
- 3512.7%Mobile Property/Vehicle Fires
- 82.9%Other
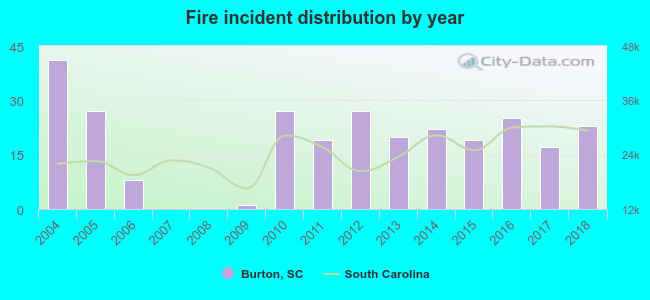 According to the data from the years 2004 - 2018 the average number of fires per year is 18. The highest number of reported fires - 41 took place in 2004, and the least - 0 in 2007. The data has a decreasing trend.
The average number of yearly fire incidents per 10k residents in Burton, SC compared to nearest cities:
(Note: Based on data for the last 3 years, including only cities with population 5,000 and above)
| Burton: | 31.1 |
| Beaufort: | 47.2 |
| Port Royal: | 17.4 |
| Hilton Head Island: | 31.6 |
| Bluffton: | 95.0 |
| Walterboro: | 425.4 |
| Johns Island: | 104.5 |
| James Island: | 12.7 |
| Charleston: | 56.7 |

 28.6% incidents where reported in the morning and 71.4% in the evening. The most fires (15.9%) took place on Friday, and the least (13.0%) on Monday.
 Based on the 276 incident reports from years 2004 - 2018 most fires (14.1%) took place during March, and the least (4.7%) in July.
 Out of all 1,969 cases reported during the years 2004 - 2018, the most belonged to the categories: Rescue & EMS (47.3%), Fire (14.0%), and Good Intent Call (13.8%).
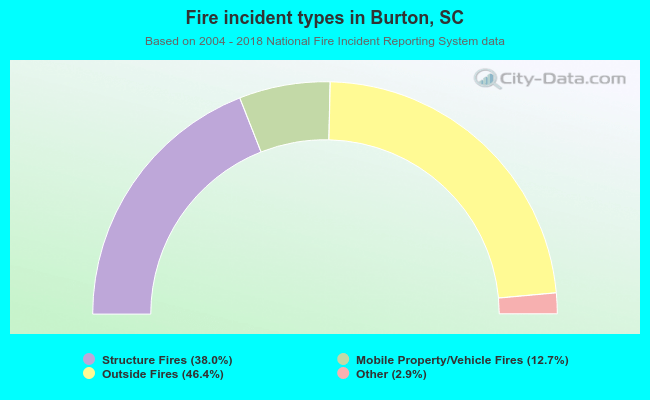 When looking into fire subcategories, the most incidents belonged to: Outside Fires (46.4%), and Structure Fires (38.0%).