Hilton Head Island: Fire Incidents, South Carolina (SC)
Where are fire incidents reported in Hilton Head Island, SC
Something went wrong! Please refresh the page.
| Fire incidents reported | |
|---|---|
| Sreet name | Count |
| FOREST BEACH DR | 68 |
| WILLIAM HILTON | 46 |
| SQUIRE POPE RD | 40 |
| MAIN ST | 38 |
| MATHEWS DR | 36 |
| WILLIAM HILTON PKWY | 36 |
| GUM TREE RD | 28 |
| SHELTER COVE LN | 28 |
| SHIPYARD DR | 28 |
| BEACH CITY RD | 22 |
| MARSHLAND RD | 22 |
| SOUTHWOOD PARK DR | 22 |
| WILLIAM HILTON PKY | 22 |
| BIRDSONG WAY | 20 |
| FOLLY FIELD RD | 20 |
| MUDDY CREEK RD | 20 |
| ARROW RD | 16 |
| GRASSLAWN AVE | 16 |
| HOTEL CIR | 16 |
| OCEAN LN | 16 |
| WOODHAVEN DR | 16 |
| CORDILLO PKWY | 14 |
| LIGHTHOUSE RD | 14 |
| WILLIAM HILTON PKWY | 14 |
| YACHT COVE DR | 14 |
| DEALLYON AVE | 12 |
| MITCHELVILLE RD | 12 |
| SEA PINES DR | 12 |
| SHELTER COVE LANE | 12 |
| BRYANT RD | 10 |
| Other | 250 |
2002 - 2018 National Fire Incident Reporting System (NFIRS) incidents
- Incident types reported to NFIRS in Hilton Head Island, SC
- 20,59668.1%Rescue & EMS
- 3,98413.2%False Alarm
- 2,9829.9%Service Call
- 9403.1%Fire
- 8782.9%Good Intent Call
- 7612.5%Hazardous Condition
- 420.1%Severe Weather
- 330.1%Overpressure Rupture
- Fire incident types reported to NFIRS in Hilton Head Island, SC
- 44847.7%Structure Fires
- 35337.6%Outside Fires
- 12413.2%Mobile Property/Vehicle Fires
- 151.6%Other
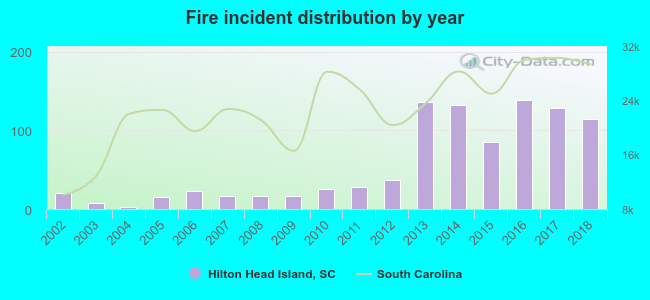 According to the data from the years 2002 - 2018 the average number of fire incidents per year is 55. The highest number of reported fire incidents - 138 took place in 2016, and the least - 2 in 2004. The data has a growing trend.
The average number of yearly fire incidents per 10k residents in Hilton Head Island, SC compared to nearest cities:
(Note: Based on data for the last 3 years, including only cities with population 5,000 and above)
| Hilton Head Island: | 31.6 |
| Bluffton: | 95.0 |
| Port Royal: | 17.4 |
| Burton: | 31.1 |
| Beaufort: | 47.2 |
| Walterboro: | 425.4 |
| Johns Island: | 104.5 |
| James Island: | 12.7 |
| Charleston: | 56.7 |
 The median response time based on all reported fire incidents is 6 minutes. This is about the same as the South Carolina median value.
The median response time in Hilton Head Island, SC compared to nearest cities:
(Note: Based on data for all years, including only cities with at least 500 fire incidents)
| Hilton Head Island: | 6 minutes |
| Bluffton: | 6 minutes |
| Beaufort: | 4 minutes |
| St. Helena: | 6 minutes |
| Hardeeville: | 6 minutes |
| Savannah: | 4 minutes |
| Ridgeland: | 6 minutes |
| Garden City: | 5 minutes |
| Port Wentworth: | 5 minutes |
 Based on the data from the years 2002 - 2018 the average number of fire-related casualties per year is 1. The highest number of casualties - 7 took place in 2017, and the lowest - 0 in 2003. The data has a rising trend.
The average number of casualties per 1,000 fires is 18. This indicator was the highest - 63 in 2009, and the lowest 0 in 2003. The trend for casualties per 1,000 fire incidents is declining. Compared to the South Carolina value the number of casualties per 1,000 fires is much higher.
Based on the data from the years 2002 - 2018 the average number of fire-related casualties per year is 1. The highest number of casualties - 7 took place in 2017, and the lowest - 0 in 2003. The data has a rising trend.
The average number of casualties per 1,000 fires is 18. This indicator was the highest - 63 in 2009, and the lowest 0 in 2003. The trend for casualties per 1,000 fire incidents is declining. Compared to the South Carolina value the number of casualties per 1,000 fires is much higher.Casualties per 1,000 incidents in Hilton Head Island, SC compared to nearest cities:
(Note: Based on data for all years, including only cities with at least 500 fire incidents)
| Hilton Head Island: | 20.2 |
| Bluffton: | 4.9 |
| Beaufort: | 4.6 |
| St. Helena: | 1.7 |
| Hardeeville: | 3.4 |
| Savannah: | 7.0 |
| Ridgeland: | 0.0 |
| Garden City: | 0.8 |
| Port Wentworth: | 1.7 |
 31.7% incidents where reported in the morning and 68.3% in the evening. The most fires (16.9%) took place on Saturday, and the least (12.0%) on Tuesday.
 Based on the 940 fires from years 2002 - 2018 most fires (11.5%) took place during July, and the least (6.7%) in October.
 Out of all 30,224 cases reported during the years 2002 - 2018, the most belonged to the categories: Rescue & EMS (68.1%), False Alarm (13.2%), and Service Call (9.9%).
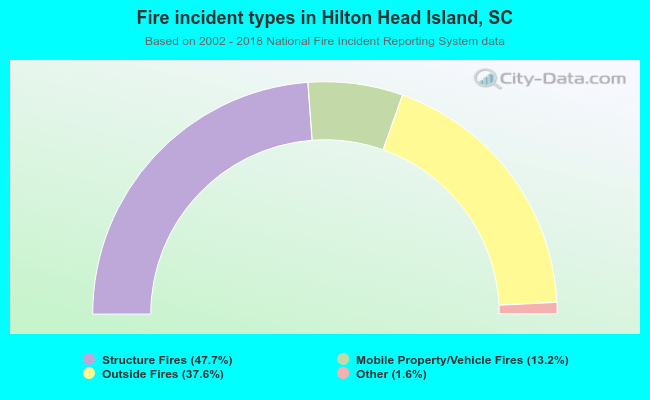 When looking into fire subcategories, the most incidents belonged to: Structure Fires (47.7%), and Outside Fires (37.6%).