Central: Fire Incidents, South Carolina (SC)
Where are fire incidents reported in Central, SC
Something went wrong! Please refresh the page.
|
| |||||||||||||||||||||||||||||||||||||||||||||||||||||||||||||||||||||||||||||||||||||||||||||||||||||||||||||
2002 - 2018 National Fire Incident Reporting System (NFIRS) incidents
- Incident types reported to NFIRS in Central, SC
- 66829.6%Hazardous Condition
- 61227.2%Fire
- 45720.3%Rescue & EMS
- 2119.4%Good Intent Call
- 1767.8%False Alarm
- 813.6%Service Call
- 351.6%Severe Weather
- 100.4%Overpressure Rupture
- 40.2%Special Incident
- Fire incident types reported to NFIRS in Central, SC
- 27144.3%Outside Fires
- 21635.3%Structure Fires
- 7412.1%Mobile Property/Vehicle Fires
- 518.3%Other
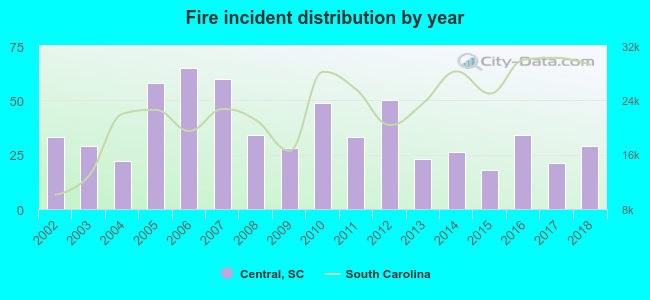 According to the data from the years 2002 - 2018 the average number of fires per year is 36. The highest number of fire incidents - 65 took place in 2006, and the least - 18 in 2015. The data has a decreasing trend.
The average number of yearly fire incidents per 10k residents in Central, SC compared to nearest cities:
(Note: Based on data for the last 3 years, including only cities with population 5,000 and above)
| Central: | 54.4 |
| Clemson: | 40.7 |
| Seneca: | 131.4 |
| Easley: | 102.0 |
| Centerville: | 15.2 |
| Anderson: | 254.5 |
| Powderville: | 49.0 |
| Oakway: | 21.1 |
| Piedmont: | 313.5 |
 The median response time based on all reported fire incidents is 6 minutes. This is comparable to the state median value.
The median response time in Central, SC compared to nearest cities:
(Note: Based on data for all years, including only cities with at least 500 fire incidents)
| Central: | 6 minutes |
| Clemson: | 6 minutes |
| Pendleton: | 8 minutes |
| Six Mile: | 7 minutes |
| Liberty: | 6 minutes |
| Seneca: | 8 minutes |
| Pickens: | 7 minutes |
| Easley: | 6 minutes |
| West Union: | 7 minutes |
 27.6% incidents where reported in the morning and 72.4% in the evening. The most fires (17.6%) took place on Friday, and the least (11.9%) on Monday.
 Based on the 612 incident reports from years 2002 - 2018 most fires (11.3%) took place during March, and the least (4.7%) in August.
 Out of all 2,254 cases reported during the years 2002 - 2018, the most belonged to the categories: Hazardous Condition (29.6%), Fire (27.2%), and Rescue & EMS (20.3%).
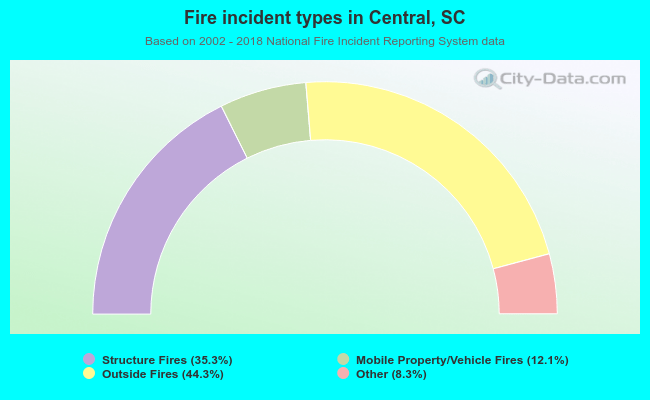 When looking into fire subcategories, the most reports belonged to: Outside Fires (44.3%), and Structure Fires (35.3%).