Pickens: Fire Incidents, South Carolina (SC)
Where are fire incidents reported in Pickens, SC
Something went wrong! Please refresh the page.
|
| |||||||||||||||||||||||||||||||||||||||||||||||||||||||||||||||||||||||||||||||||||||||||||||||||||||||||||||
| Other | 218 | |||||||||||||||||||||||||||||||||||||||||||||||||||||||||||||||||||||||||||||||||||||||||||||||||||||||||||||
2002 - 2018 National Fire Incident Reporting System (NFIRS) incidents
- Incident types reported to NFIRS in Pickens, SC
- 1,18927.3%Rescue & EMS
- 1,13025.9%Fire
- 82118.8%Hazardous Condition
- 51611.8%Good Intent Call
- 3317.6%Service Call
- 3157.2%False Alarm
- 380.9%Severe Weather
- 180.4%Special Incident
- Fire incident types reported to NFIRS in Pickens, SC
- 49844.1%Outside Fires
- 44939.7%Structure Fires
- 12411.0%Mobile Property/Vehicle Fires
- 595.2%Other
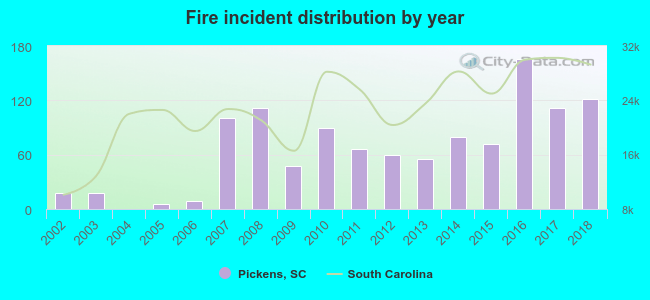 According to the data from the years 2002 - 2018 the average number of fire incidents per year is 66. The highest number of fire incidents - 166 took place in 2016, and the least - 0 in 2004. The data has a growing trend.
 The median response time based on all reported fire incidents is 7 minutes. This is similar to the state median value.
The median response time in Pickens, SC compared to nearest cities:
(Note: Based on data for all years, including only cities with at least 500 fire incidents)
| Pickens: | 7 minutes |
| Liberty: | 6 minutes |
| Easley: | 6 minutes |
| Six Mile: | 7 minutes |
| Central: | 6 minutes |
| Clemson: | 6 minutes |
| Travelers Rest: | 7 minutes |
| Pendleton: | 8 minutes |
| Greenville: | 4 minutes |
 According to the data from the years 2002 - 2018 the average number of fire-related fatalities per year is 0. The highest number of reported deaths - 1 took place in 2003, and the lowest - 0 in 2002. The data has a constant trend.
 28.6% incidents where reported in the morning and 71.4% in the evening. The most fires (16.7%) took place on Saturday, and the least (13.2%) on Sunday.
 Based on the 1,130 fires from years 2002 - 2018 most fires (12.3%) took place during November, and the least (5.2%) in September.
 Out of all 4,362 cases reported during the years 2002 - 2018, the most belonged to the categories: Rescue & EMS (27.3%), Fire (25.9%), and Hazardous Condition (18.8%).
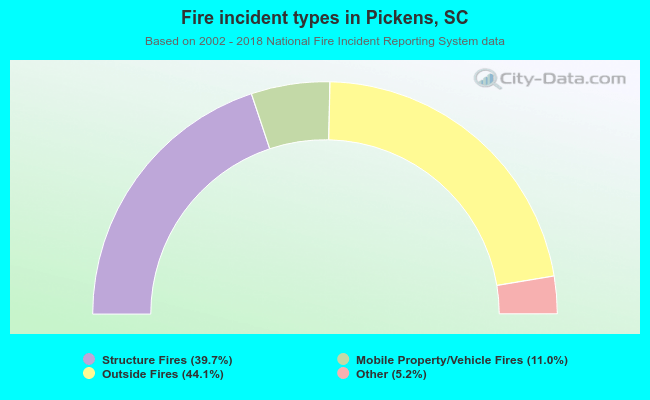 When looking into fire subcategories, the most incidents belonged to: Outside Fires (44.1%), and Structure Fires (39.7%).