East Cleveland: Fire Incidents, Ohio (OH)
Where are fire incidents reported in East Cleveland, OH
Something went wrong! Please refresh the page.
| Fire incidents reported | |
|---|---|
| Sreet name | Count |
| TERRACE RD | 196 |
| SUPERIOR (SOUTH) RD | 134 |
| SUPERIORSOUTH RD | 106 |
| EUCLIDSOUTH AVE | 98 |
| EUCLID (NORTHCENTER) AVE | 88 |
| NOBLE RD | 72 |
| SAVANNAH AVE | 64 |
| STRATHMORE AVE | 64 |
| PAGE AVE | 60 |
| 125 ST | 52 |
| EUCLIDNORTHCENTER AVE | 52 |
| ORINOCO AVE | 52 |
| TERRACE (SOUTHEAST) RD | 52 |
| EUCLID (NORTH) AVE | 50 |
| EUCLID (SOUTH) AVE | 48 |
| ARDENALL AVE | 46 |
| ELM AVE | 40 |
| EUCLIDSOUTHCENTER AVE | 40 |
| PRIVATE DR | 40 |
| SUPERIORNORTH AVE | 40 |
| THORNHILL DR | 40 |
| EUCLID AVE | 38 |
| NORTHFIELD AVE | 36 |
| BENDER AVE | 32 |
| MELBOURNE RD | 32 |
| WYMORE ST | 32 |
| 133RDNORTH ST | 30 |
| BELMAR RD | 30 |
| CARLYON | 30 |
| CHAPMAN AVE | 30 |
| Other | 508 |
2004 - 2018 National Fire Incident Reporting System (NFIRS) incidents
- Incident types reported to NFIRS in East Cleveland, OH
- 2,23237.8%Fire
- 1,46124.8%Hazardous Condition
- 82013.9%Service Call
- 67411.4%False Alarm
- 4617.8%Rescue & EMS
- 1893.2%Good Intent Call
- 350.6%Overpressure Rupture
- 220.4%Special Incident
- Fire incident types reported to NFIRS in East Cleveland, OH
- 1,43964.5%Structure Fires
- 42218.9%Outside Fires
- 36816.5%Mobile Property/Vehicle Fires
- 30.1%Other
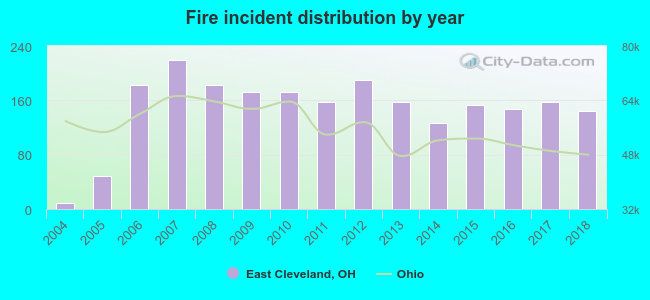 Based on the data from the years 2004 - 2018 the average number of fires per year is 148. The highest number of fires - 220 took place in 2007, and the least - 9 in 2004. The data has a rising trend.
The average number of yearly fire incidents per 10k residents in East Cleveland, OH compared to nearest cities:
(Note: Based on data for the last 3 years, including only cities with population 5,000 and above)
| East Cleveland: | 85.7 |
| Cleveland Heights: | 40.4 |
| South Euclid: | 30.5 |
| University Heights: | 50.2 |
| Shaker Heights: | 34.3 |
| Richmond Heights: | 52.1 |
| Lyndhurst: | 28.4 |
| Beachwood: | 34.5 |
| Euclid: | 44.4 |
 The median response time based on all reported fire incidents is 3 minutes. This is much lower than the Ohio median value.
The median response time in East Cleveland, OH compared to nearest cities:
(Note: Based on data for all years, including only cities with at least 500 fire incidents)
| East Cleveland: | 3 minutes |
| Cleveland Heights: | 5 minutes |
| South Euclid: | 6 minutes |
| University Heights: | 5 minutes |
| Shaker Heights: | 4 minutes |
| Lyndhurst: | 5 minutes |
| Beachwood: | 4 minutes |
| Euclid: | 5 minutes |
| Cleveland: | 5 minutes |
 Based on the data from the years 2004 - 2018 the average number of fire-related yearly deaths is 0. The highest number of reported deaths - 3 took place in 2009, and the lowest - 0 in 2004. The data has a constant trend.
 According to the data from the years 2004 - 2018 the average number of fire-related yearly casualties is 2. The highest number of reported casualties - 9 took place in 2012, and the lowest - 0 in 2004. The data has a constant trend.
The average number of casualties per 1,000 fire incidents is 11. This indicator was the highest - 47 in 2012, and the lowest 0 in 2004. The trend for injuries per 1,000 incidents is constant. Compared to the Ohio value the number of injuries per 1,000 incidents is similar.
According to the data from the years 2004 - 2018 the average number of fire-related yearly casualties is 2. The highest number of reported casualties - 9 took place in 2012, and the lowest - 0 in 2004. The data has a constant trend.
The average number of casualties per 1,000 fire incidents is 11. This indicator was the highest - 47 in 2012, and the lowest 0 in 2004. The trend for injuries per 1,000 incidents is constant. Compared to the Ohio value the number of injuries per 1,000 incidents is similar.Casualties per 1,000 incidents in East Cleveland, OH compared to nearest cities:
(Note: Based on data for all years, including only cities with at least 500 fire incidents)
| East Cleveland: | 13.0 |
| Cleveland Heights: | 16.1 |
| South Euclid: | 35.4 |
| University Heights: | 17.9 |
| Shaker Heights: | 49.0 |
| Lyndhurst: | 12.4 |
| Beachwood: | 2.9 |
| Euclid: | 15.5 |
| Cleveland: | 17.3 |
 38.4% incidents where reported in the morning and 61.6% in the evening. The most fires (15.4%) took place on Sunday, and the least (12.8%) on Friday.
 Based on the 2,232 reports from years 2004 - 2018 most fires (9.9%) took place during July, and the least (6.6%) in September.
 Out of all 5,897 cases reported during the years 2004 - 2018, the most belonged to the categories: Fire (37.8%), Hazardous Condition (24.8%), and Service Call (13.9%).
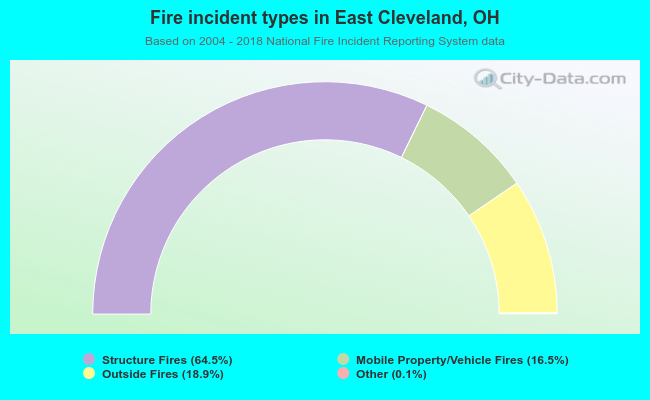 When looking into fire subcategories, the most reports belonged to: Structure Fires (64.5%), and Outside Fires (18.9%).