Lyndhurst: Fire Incidents, Ohio (OH)
Where are fire incidents reported in Lyndhurst, OH
Something went wrong! Please refresh the page.
| Fire incidents reported | |
|---|---|
| Sreet name | Count |
| MAYFIELD RD | 152 |
| CEDAR | 126 |
| RICHMOND | 102 |
| ACACIA PARK | 68 |
| THREE VILLAGE | 40 |
| BRAINARD | 36 |
| IINTERSTATE 271 HWY | 34 |
| SPENCER | 30 |
| MAYFIELD | 26 |
| RIDGEBURY | 26 |
| WINCHESTER | 26 |
| CLEARVIEW | 24 |
| HAVERSTON | 24 |
| SUNVIEW | 24 |
| CLUBSIDE | 20 |
| ANDERSON | 18 |
| FARNHURST | 18 |
| OVERBROOK | 18 |
| CROYDEN | 16 |
| GLENLYN | 16 |
| CASE | 14 |
| ACACIA | 12 |
| BLANCHESTER | 12 |
| EASTOVER | 12 |
| EDGEFIELD | 12 |
| EDSAL | 12 |
| GORDON | 12 |
| HAVERFORD | 12 |
| LYNDHURST | 12 |
| SUMMIT | 12 |
2002 - 2018 National Fire Incident Reporting System (NFIRS) incidents
- Incident types reported to NFIRS in Lyndhurst, OH
- 8,98065.0%Rescue & EMS
- 1,65011.9%Hazardous Condition
- 9456.8%Service Call
- 8386.1%False Alarm
- 8095.9%Fire
- 5393.9%Good Intent Call
- 240.2%Severe Weather
- 230.2%Special Incident
- Fire incident types reported to NFIRS in Lyndhurst, OH
- 53666.3%Structure Fires
- 18923.4%Outside Fires
- 799.8%Mobile Property/Vehicle Fires
- 50.6%Other
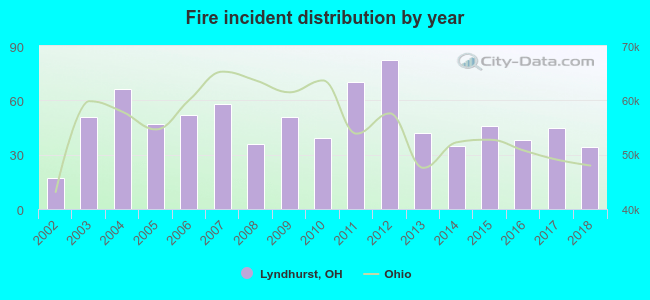 According to the data from the years 2002 - 2018 the average number of fire incidents per year is 48. The highest number of fires - 82 took place in 2012, and the least - 17 in 2002. The data has a rising trend.
The average number of yearly fire incidents per 10k residents in Lyndhurst, OH compared to nearest cities:
(Note: Based on data for the last 3 years, including only cities with population 5,000 and above)
| Lyndhurst: | 28.4 |
| Mayfield Heights: | 26.7 |
| South Euclid: | 30.5 |
| Highland Heights: | 34.7 |
| Richmond Heights: | 52.1 |
| Beachwood: | 34.5 |
| University Heights: | 50.2 |
| Pepper Pike: | 24.7 |
| Cleveland Heights: | 40.4 |
 The median response time based on all reported fire incidents is 5 minutes. This is lower than the state median value.
The median response time in Lyndhurst, OH compared to nearest cities:
(Note: Based on data for all years, including only cities with at least 500 fire incidents)
| Lyndhurst: | 5 minutes |
| Mayfield Heights: | 4 minutes |
| South Euclid: | 6 minutes |
| Beachwood: | 4 minutes |
| University Heights: | 5 minutes |
| Cleveland Heights: | 5 minutes |
| Shaker Heights: | 4 minutes |
| East Cleveland: | 3 minutes |
| Willoughby Hills: | 7 minutes |
 Based on the reports from the years 2002 - 2018 the average number of fire-related yearly casualties is 1. The highest number of injuries - 3 took place in 2003, and the lowest - 0 in 2002. The data has a constant trend.
The average number of casualties per 1,000 fire incidents is 11. This indicator was the highest - 59 in 2003, and the lowest 0 in 2002. The trend for injuries per 1,000 incidents is constant. Compared to the state value the number of injuries per 1,000 fires is about the same.
Based on the reports from the years 2002 - 2018 the average number of fire-related yearly casualties is 1. The highest number of injuries - 3 took place in 2003, and the lowest - 0 in 2002. The data has a constant trend.
The average number of casualties per 1,000 fire incidents is 11. This indicator was the highest - 59 in 2003, and the lowest 0 in 2002. The trend for injuries per 1,000 incidents is constant. Compared to the state value the number of injuries per 1,000 fires is about the same.Casualties per 1,000 incidents in Lyndhurst, OH compared to nearest cities:
(Note: Based on data for all years, including only cities with at least 500 fire incidents)
| Lyndhurst: | 12.4 |
| Mayfield Heights: | 5.3 |
| South Euclid: | 35.4 |
| Beachwood: | 2.9 |
| University Heights: | 17.9 |
| Cleveland Heights: | 16.1 |
| Shaker Heights: | 49.0 |
| East Cleveland: | 13.0 |
| Willoughby Hills: | 14.3 |
 29.8% incidents where reported in the morning and 70.2% in the evening. The most fires (20.1%) took place on Thursday, and the least (11.0%) on Friday.
 Based on the 809 reports from years 2002 - 2018 most fires (11.7%) took place during March, and the least (5.9%) in January.
 Out of all 13,821 cases reported during the years 2002 - 2018, the most belonged to the categories: Rescue & EMS (65.0%), Hazardous Condition (11.9%), and Service Call (6.8%).
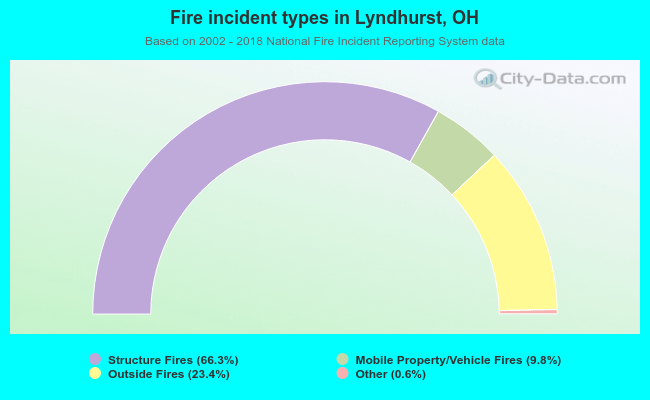 When looking into fire subcategories, the most incidents belonged to: Structure Fires (66.3%), and Outside Fires (23.4%).