Richmond Heights: Fire Incidents, Ohio (OH)
Where are fire incidents reported in Richmond Heights, OH
Something went wrong! Please refresh the page.
|
| |||||||||||||||||||||||||||||||||||||||||||||||||||||||||||||||||||||||||||||||||||||||||||||||||||||||||||||
2003 - 2018 National Fire Incident Reporting System (NFIRS) incidents
- Incident types reported to NFIRS in Richmond Heights, OH
- 6,03274.9%Rescue & EMS
- 5727.1%False Alarm
- 4305.3%Good Intent Call
- 3524.4%Hazardous Condition
- 3264.0%Fire
- 3234.0%Service Call
- 110.1%Special Incident
- Fire incident types reported to NFIRS in Richmond Heights, OH
- 25778.8%Structure Fires
- 3510.7%Outside Fires
- 3310.1%Mobile Property/Vehicle Fires
- 10.3%Other
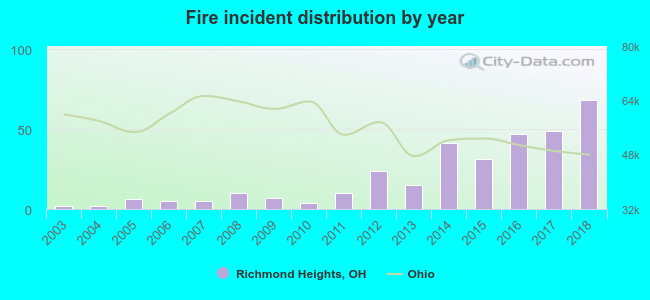 Based on the data from the years 2003 - 2018 the average number of fire incidents per year is 20. The highest number of fires - 68 took place in 2018, and the least - 2 in 2003. The data has a rising trend.
The average number of yearly fire incidents per 10k residents in Richmond Heights, OH compared to nearest cities:
(Note: Based on data for the last 3 years, including only cities with population 5,000 and above)
| Richmond Heights: | 52.1 |
| Highland Heights: | 34.7 |
| Lyndhurst: | 28.4 |
| Euclid: | 44.4 |
| South Euclid: | 30.5 |
| Mayfield Heights: | 26.7 |
| Willoughby Hills: | 56.7 |
| Wickliffe: | 50.3 |
| East Cleveland: | 85.7 |

 According to the data from the years 2003 - 2018 the average number of fire-related yearly casualties is 1. The highest number of reported casualties - 8 took place in 2018, and the lowest - 0 in 2003. The data has a growing trend.
 27.6% incidents where reported in the morning and 72.4% in the evening. The most fires (19.0%) took place on Friday, and the least (10.7%) on Thursday.
 Based on the 326 fire incidents from years 2003 - 2018 most fires (14.4%) took place during February, and the least (3.7%) in August.
 Out of all 8,053 cases reported during the years 2003 - 2018, the most belonged to the categories: Rescue & EMS (74.9%), False Alarm (7.1%), and Good Intent Call (5.3%).
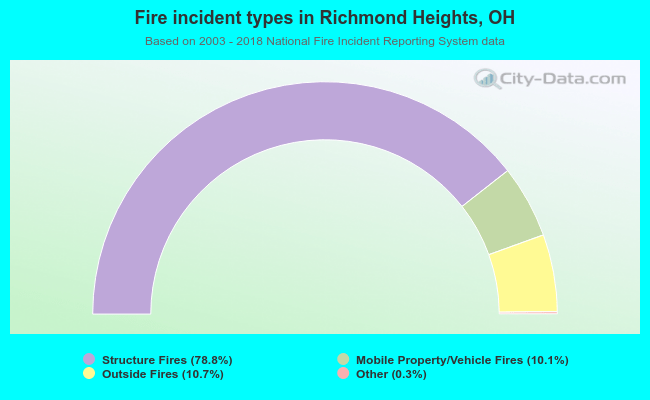 When looking into fire subcategories, the most incidents belonged to: Structure Fires (78.8%), and Outside Fires (10.7%).