Wickliffe: Fire Incidents, Ohio (OH)
Where are fire incidents reported in Wickliffe, OH
Something went wrong! Please refresh the page.
| Fire incidents reported | |
|---|---|
| Sreet name | Count |
| EUCLID AVE | 258 |
| LAKELAND BLVD | 146 |
| 289TH ST | 56 |
| LLOYD RD | 56 |
| RIDGE RD | 52 |
| ROCKEFELLER RD | 40 |
| RIDGEWICK DR | 36 |
| ANDERSON RD | 34 |
| BISHOP RD | 34 |
| CLAYTON AVE | 28 |
| ROBERT ST | 26 |
| TRUMAN AVE | 24 |
| 300TH ST | 20 |
| DOUGLAS RD | 20 |
| ELDON DR | 18 |
| LAKELAND | 18 |
| PALISADES PKY | 18 |
| HARDING DR | 16 |
| LINCOLN RD | 16 |
| WORDEN RD | 16 |
| EUCLID | 14 |
| RUSH RD | 14 |
| 289 ST | 12 |
| 296 ST | 12 |
| CRANEING RD | 12 |
| EMPIRE RD | 12 |
| REGENT RD | 12 |
| RIDGE | 12 |
| 290TH ST | 10 |
| BISHOP | 10 |
2002 - 2018 National Fire Incident Reporting System (NFIRS) incidents
- Incident types reported to NFIRS in Wickliffe, OH
- 8,35060.2%Rescue & EMS
- 2,17315.7%Hazardous Condition
- 1,2358.9%Service Call
- 9336.7%Fire
- 7885.7%False Alarm
- 3372.4%Good Intent Call
- 300.2%Special Incident
- 170.1%Overpressure Rupture
- Fire incident types reported to NFIRS in Wickliffe, OH
- 55058.9%Structure Fires
- 24326.0%Outside Fires
- 13814.8%Mobile Property/Vehicle Fires
- 20.2%Other
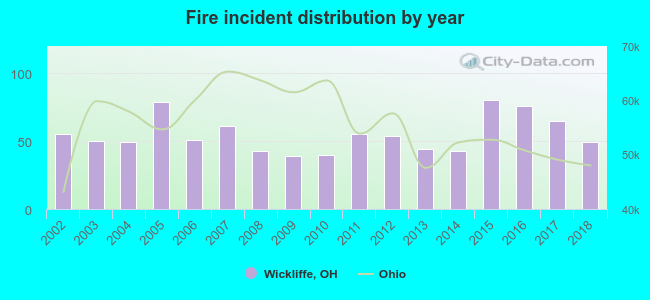 Based on the data from the years 2002 - 2018 the average number of fire incidents per year is 55. The highest number of reported fires - 80 took place in 2015, and the least - 39 in 2009. The data has a declining trend.
The average number of yearly fire incidents per 10k residents in Wickliffe, OH compared to nearest cities:
(Note: Based on data for the last 3 years, including only cities with population 5,000 and above)
| Wickliffe: | 50.3 |
| Willowick: | 35.7 |
| Willoughby Hills: | 56.7 |
| Euclid: | 44.4 |
| Richmond Heights: | 52.1 |
| Highland Heights: | 34.7 |
| Eastlake: | 50.2 |
| Willoughby: | 58.9 |
| Lyndhurst: | 28.4 |
 The median response time based on all reported fire incidents is 5 minutes. This is lower than the Ohio median value.
The median response time in Wickliffe, OH compared to nearest cities:
(Note: Based on data for all years, including only cities with at least 500 fire incidents)
| Wickliffe: | 5 minutes |
| Willowick: | 4 minutes |
| Willoughby Hills: | 7 minutes |
| Euclid: | 5 minutes |
| Eastlake: | 5 minutes |
| Willoughby: | 4 minutes |
| Lyndhurst: | 5 minutes |
| Mayfield Heights: | 4 minutes |
| Kirtland: | 6 minutes |
 Based on the reports from the years 2002 - 2018 the average number of fire-related yearly casualties is 1. The highest number of reported injuries - 4 took place in 2006, and the lowest - 0 in 2002. The data has a constant trend.
The average number of injuries per 1,000 fire incidents is 23. This indicator was the highest - 93 in 2008, and the lowest 0 in 2002. The trend for casualties per 1,000 fire incidents is constant. Compared to the state value the number of injuries per 1,000 incidents is higher.
Based on the reports from the years 2002 - 2018 the average number of fire-related yearly casualties is 1. The highest number of reported injuries - 4 took place in 2006, and the lowest - 0 in 2002. The data has a constant trend.
The average number of injuries per 1,000 fire incidents is 23. This indicator was the highest - 93 in 2008, and the lowest 0 in 2002. The trend for casualties per 1,000 fire incidents is constant. Compared to the state value the number of injuries per 1,000 incidents is higher.Casualties per 1,000 incidents in Wickliffe, OH compared to nearest cities:
(Note: Based on data for all years, including only cities with at least 500 fire incidents)
| Wickliffe: | 22.5 |
| Willowick: | 12.7 |
| Willoughby Hills: | 14.3 |
| Euclid: | 15.5 |
| Eastlake: | 55.6 |
| Willoughby: | 41.4 |
| Lyndhurst: | 12.4 |
| Mayfield Heights: | 5.3 |
| Kirtland: | 3.4 |
 30.4% incidents where reported in the morning and 69.6% in the evening. The most fires (18.1%) took place on Friday, and the least (11.8%) on Sunday.
 Based on the 933 fire incident reports from years 2002 - 2018 most fires (13.0%) took place during July, and the least (5.8%) in February.
 Out of all 13,868 cases reported during the years 2002 - 2018, the most belonged to the categories: Rescue & EMS (60.2%), Hazardous Condition (15.7%), and Service Call (8.9%).
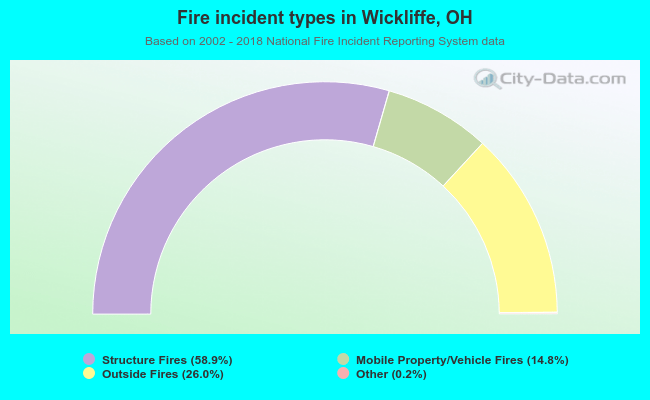 When looking into fire subcategories, the most reports belonged to: Structure Fires (58.9%), and Outside Fires (26.0%).