East Ridge: Fire Incidents, Tennessee (TN)
Where are fire incidents reported in East Ridge, TN
Something went wrong! Please refresh the page.
| Fire incidents reported | |
|---|---|
| Sreet name | Count |
| RINGGOLD RD | 500 |
| MACK SMITH RD | 106 |
| BENNETT RD | 94 |
| SPRING CREEK RD | 76 |
| SEMINOLE DR | 74 |
| JOHN ROSS RD | 64 |
| MCBRIEN RD | 64 |
| GLEASON DR | 50 |
| FOUNTAIN AVE | 44 |
| FRAWLEY RD | 42 |
| TOMBRAS AVE | 38 |
| CONNELL ST | 36 |
| PRIGMORE RD | 36 |
| DONALDSON RD | 34 |
| MOORE RD | 32 |
| MARION AVE | 28 |
| BELVOIR AVE | 26 |
| GREENSLAKE RD | 26 |
| CLEMONS RD | 24 |
| LAZARD ST | 22 |
| OAKDALE AVE | 22 |
| SOUTH SEMINOLE DR | 22 |
| COVINGTON DR | 20 |
| EALY RD | 20 |
| EAST RIDGE DR | 20 |
| WENTWORTH AVE | 20 |
| ANDERSON AVE | 18 |
| DUPONT ST | 18 |
| KEEBLE ST | 18 |
| PLEASANT ST | 18 |
| Other | 173 |
2003 - 2018 National Fire Incident Reporting System (NFIRS) incidents
- Incident types reported to NFIRS in East Ridge, TN
- 11,04053.6%Rescue & EMS
- 3,10715.1%Hazardous Condition
- 2,19710.7%Service Call
- 1,7858.7%Fire
- 1,2225.9%False Alarm
- 1,2185.9%Good Intent Call
- Fire incident types reported to NFIRS in East Ridge, TN
- 89450.1%Structure Fires
- 61434.4%Outside Fires
- 25214.1%Mobile Property/Vehicle Fires
- 251.4%Other
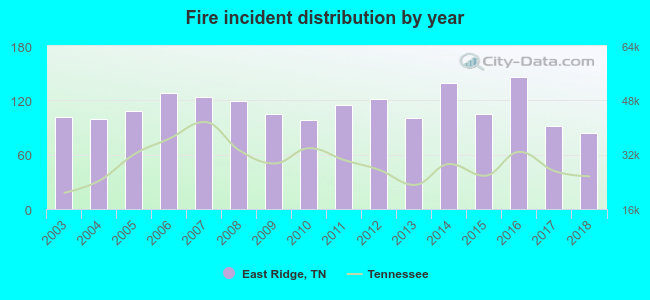 Based on the data from the years 2003 - 2018 the average number of fires per year is 112. The highest number of reported fires - 146 took place in 2016, and the least - 84 in 2018. The data has a dropping trend.
The average number of yearly fire incidents per 10k residents in East Ridge, TN compared to nearest cities:
(Note: Based on data for the last 3 years, including only cities with population 5,000 and above)
| East Ridge: | 50.4 |
| Chattanooga: | 46.2 |
| Red Bank: | 2.5 |
| Harrison: | 9.9 |
| Signal Mountain: | 64.2 |
| Collegedale: | 15.5 |
| Cleveland: | 116.6 |
| Sale Creek: | 8.3 |
| Dunlap: | 113.1 |
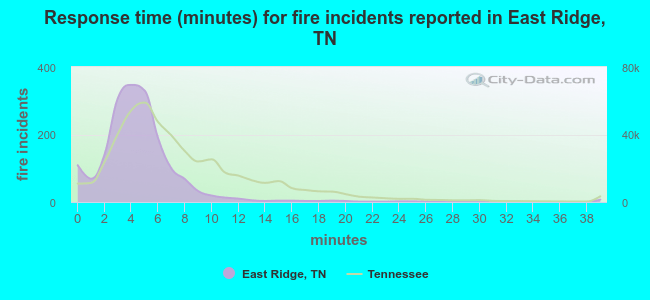 The median response time based on all reported fire incidents is 4 minutes. This is lower than the state median value.
The median response time in East Ridge, TN compared to nearest cities:
(Note: Based on data for all years, including only cities with at least 500 fire incidents)
| East Ridge: | 4 minutes |
| Rossville: | 9 minutes |
| Fort Oglethorpe: | 6 minutes |
| Chattanooga: | 5 minutes |
| Ringgold: | 9 minutes |
| Chickamauga: | 11 minutes |
| Ooltewah: | 8 minutes |
| Signal Mountain: | 6 minutes |
| Rock Spring: | 8 minutes |
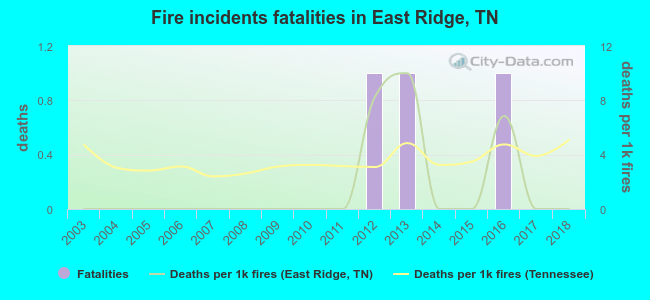 Based on the data from the years 2003 - 2018 the average number of fire-related yearly deaths is 0. The highest number of deaths - 1 took place in 2012, and the lowest - 0 in 2003. The data has a constant trend.
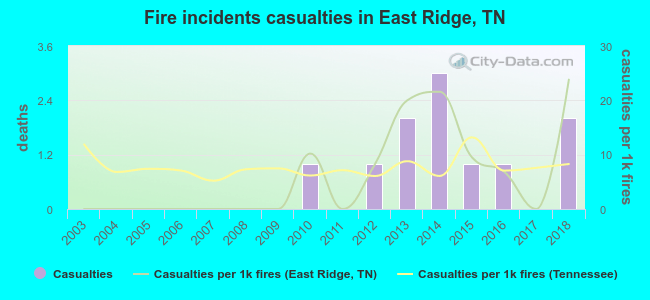 Based on the reports from the years 2003 - 2018 the average number of fire-related casualties per year is 1. The highest number of casualties - 3 took place in 2014, and the lowest - 0 in 2003. The data has a rising trend.
The average number of casualties per 1,000 fires is 6. This indicator was the highest - 24 in 2018, and the lowest 0 in 2003. The trend for casualties per 1,000 fires is increasing. Compared to the state value the number of injuries per 1,000 fire incidents is lower.
Based on the reports from the years 2003 - 2018 the average number of fire-related casualties per year is 1. The highest number of casualties - 3 took place in 2014, and the lowest - 0 in 2003. The data has a rising trend.
The average number of casualties per 1,000 fires is 6. This indicator was the highest - 24 in 2018, and the lowest 0 in 2003. The trend for casualties per 1,000 fires is increasing. Compared to the state value the number of injuries per 1,000 fire incidents is lower.Casualties per 1,000 incidents in East Ridge, TN compared to nearest cities:
(Note: Based on data for all years, including only cities with at least 500 fire incidents)
| East Ridge: | 6.2 |
| Rossville: | 15.0 |
| Fort Oglethorpe: | 15.2 |
| Chattanooga: | 8.7 |
| Ringgold: | 3.5 |
| Chickamauga: | 14.2 |
| Ooltewah: | 0.0 |
| Signal Mountain: | 1.5 |
| Rock Spring: | 11.3 |
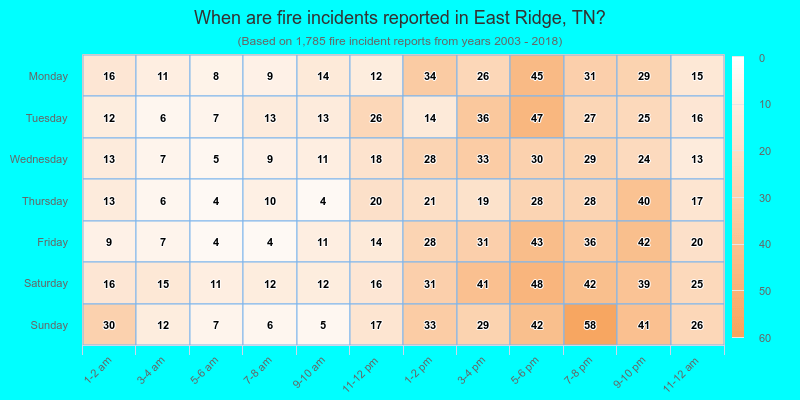
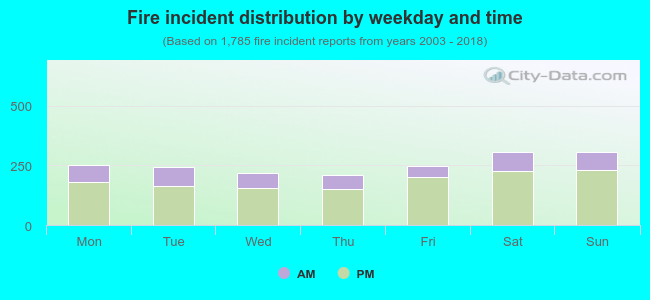 26.6% incidents where reported in the morning and 73.4% in the evening. The most fires (17.3%) took place on Saturday, and the least (11.8%) on Thursday.
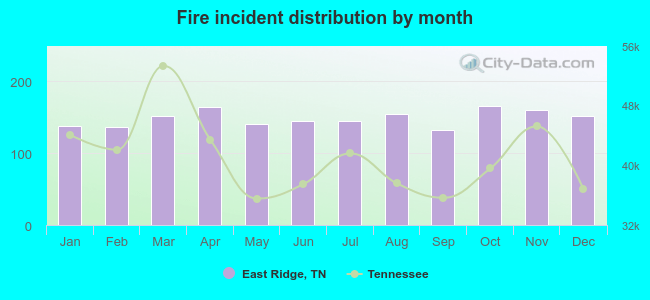 Based on the 1,785 incident reports from years 2003 - 2018 most fires (9.3%) took place during October, and the least (7.4%) in September.
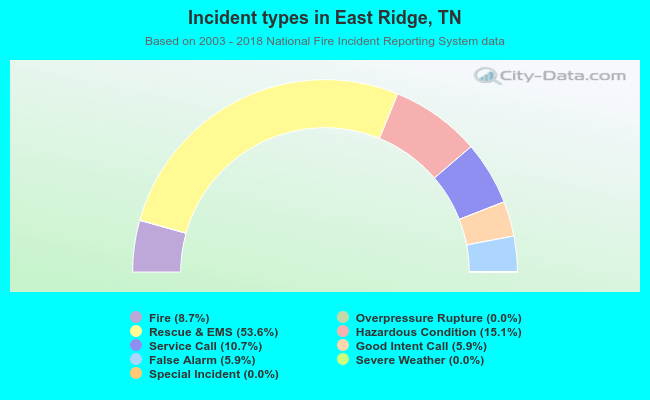 Out of all 20,586 cases reported during the years 2003 - 2018, the most belonged to the categories: Rescue & EMS (53.6%), Hazardous Condition (15.1%), and Service Call (10.7%).
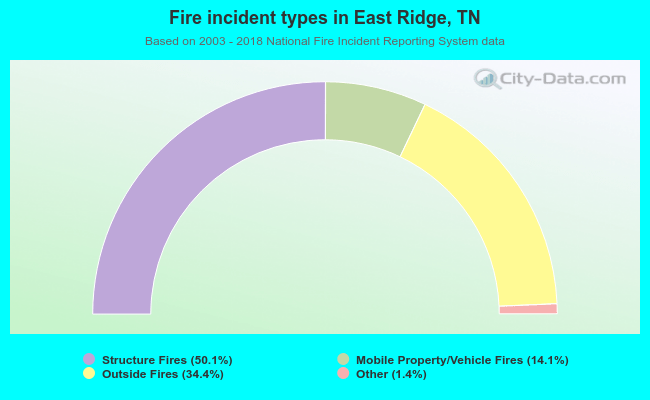 When looking into fire subcategories, the most reports belonged to: Structure Fires (50.1%), and Outside Fires (34.4%).