Effingham: Fire Incidents, Illinois (IL)
Where are fire incidents reported in Effingham, IL
Something went wrong! Please refresh the page.
| Fire incidents reported | |
|---|---|
| Sreet name | Count |
| HENRIETTA ST | 190 |
| FAYETTE AVE | 186 |
| BANKER ST | 170 |
| VETERANS DR | 156 |
| 3RD ST | 108 |
| MAPLE ST | 100 |
| 4TH ST | 96 |
| EVERGREEN AVE | 94 |
| KELLER DR | 94 |
| JEFFERSON AVE | 40 |
| MERCHANT ST | 38 |
| RICHLAND AVE | 36 |
| I57 | 32 |
| AVE OF MID AMERICA | 28 |
| TEMPLE AVE | 28 |
| WILLOW ST | 28 |
| 5TH ST | 24 |
| AVE OF MID-AMERICA | 24 |
| CHERRY ST | 24 |
| WABASH AVE | 24 |
| EASY BREEZE | 22 |
| I70 | 22 |
| EDGAR AVE | 20 |
| ST ANTHONY AVE | 20 |
| LAKEWOOD MANOR DR | 18 |
| NATIONAL AVE | 18 |
| 1ST ST | 16 |
| 2ND ST | 16 |
| EICHE AVE | 16 |
| INTERSTATE 57 | 16 |
2004 - 2018 National Fire Incident Reporting System (NFIRS) incidents
- Incident types reported to NFIRS in Effingham, IL
- 1,67232.4%Fire
- 86416.7%Hazardous Condition
- 86216.7%False Alarm
- 77815.1%Rescue & EMS
- 52710.2%Service Call
- 3807.4%Good Intent Call
- 330.6%Overpressure Rupture
- 310.6%Special Incident
- 130.3%Severe Weather
- Fire incident types reported to NFIRS in Effingham, IL
- 71642.8%Structure Fires
- 61136.5%Outside Fires
- 30718.4%Mobile Property/Vehicle Fires
- 382.3%Other
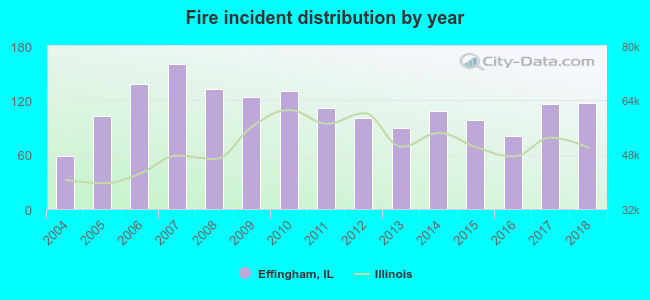 According to the data from the years 2004 - 2018 the average number of fire incidents per year is 111. The highest number of fires - 160 took place in 2007, and the least - 59 in 2004. The data has a rising trend.
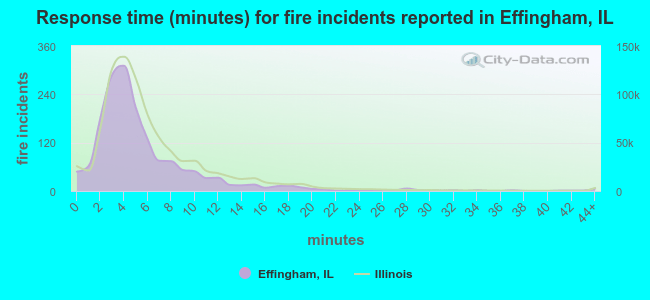 The median response time based on all reported fire incidents is 4 minutes. This is lower compared to the Illinois median value.
The median response time in Effingham, IL compared to nearest cities:
(Note: Based on data for all years, including only cities with at least 500 fire incidents)
| Effingham: | 4 minutes |
| Newton: | 7 minutes |
| Shelbyville: | 6 minutes |
| Mattoon: | 4 minutes |
| Vandalia: | 8 minutes |
| Charleston: | 3 minutes |
| Sullivan: | 7 minutes |
| Pana: | 7 minutes |
| Olney: | 5 minutes |
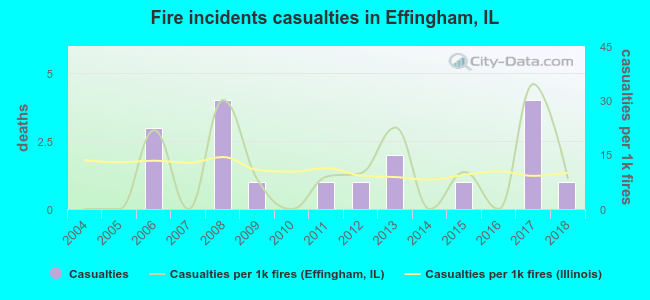 According to the data from the years 2004 - 2018 the average number of fire-related yearly casualties is 1. The highest number of reported casualties - 4 took place in 2008, and the lowest - 0 in 2004. The data has a growing trend.
The average number of injuries per 1,000 fire incidents is 10. This indicator was the highest - 34 in 2017, and the lowest 0 in 2004. The trend for casualties per 1,000 incidents is increasing. Compared to the Illinois value the number of casualties per 1,000 incidents is similar.
According to the data from the years 2004 - 2018 the average number of fire-related yearly casualties is 1. The highest number of reported casualties - 4 took place in 2008, and the lowest - 0 in 2004. The data has a growing trend.
The average number of injuries per 1,000 fire incidents is 10. This indicator was the highest - 34 in 2017, and the lowest 0 in 2004. The trend for casualties per 1,000 incidents is increasing. Compared to the Illinois value the number of casualties per 1,000 incidents is similar.Casualties per 1,000 incidents in Effingham, IL compared to nearest cities:
(Note: Based on data for all years, including only cities with at least 500 fire incidents)
| Effingham: | 10.8 |
| Newton: | 14.9 |
| Shelbyville: | 5.9 |
| Mattoon: | 15.2 |
| Vandalia: | 19.2 |
| Charleston: | 17.3 |
| Sullivan: | 11.1 |
| Pana: | 16.0 |
| Olney: | 27.3 |
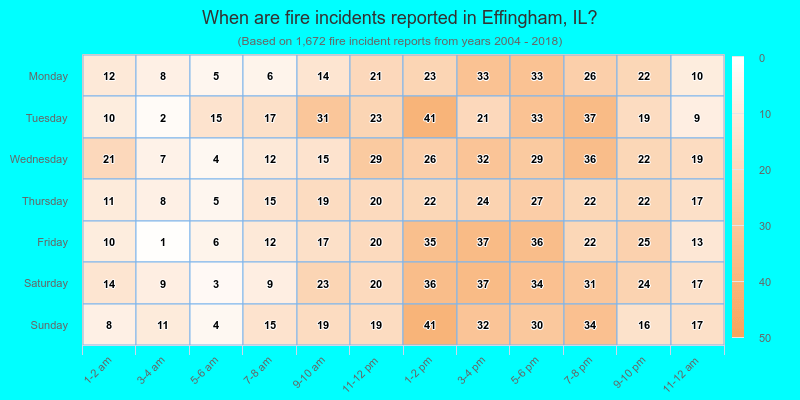
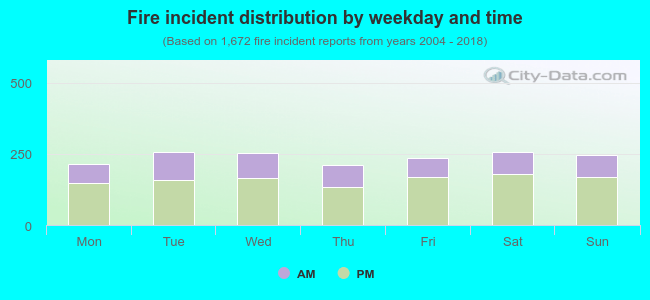 32.9% incidents where reported in the morning and 67.1% in the evening. The most fires (15.4%) took place on Tuesday, and the least (12.7%) on Thursday.
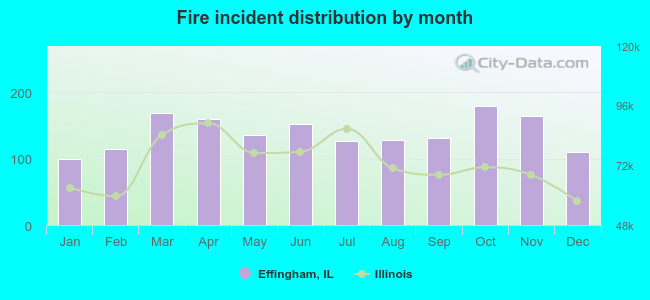 According to the 1,672 fire incidents from years 2004 - 2018 most fires (10.8%) took place during October, and the least (5.9%) in January.
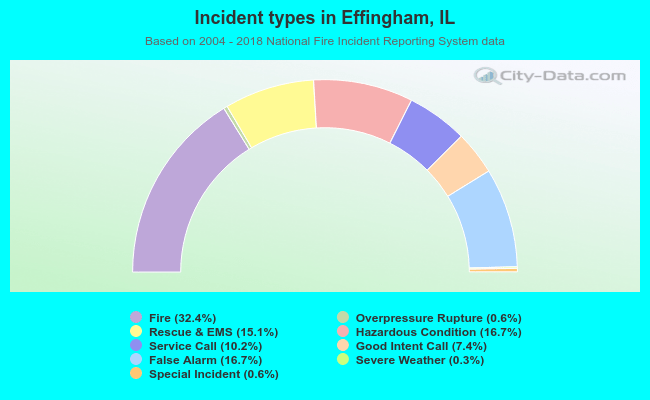 Out of all 5,160 cases reported during the years 2004 - 2018, the most belonged to the categories: Fire (32.4%), Hazardous Condition (16.7%), and False Alarm (16.7%).
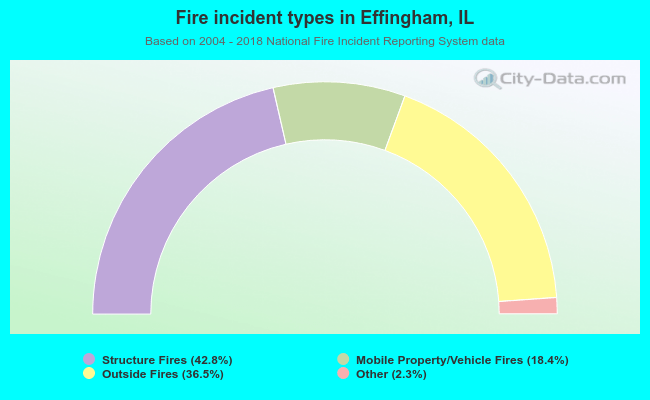 When looking into fire subcategories, the most reports belonged to: Structure Fires (42.8%), and Outside Fires (36.5%).