Mattoon: Fire Incidents, Illinois (IL)
Where are fire incidents reported in Mattoon, IL
Something went wrong! Please refresh the page.
| Fire incidents reported | |
|---|---|
| Sreet name | Count |
| DEWITT AVE | 192 |
| BROADWAY AVE | 134 |
| CHARLESTON AVE | 108 |
| LAKELAND BLVD | 104 |
| SHELBY AVE | 102 |
| MOULTRIE AVE | 100 |
| CHAMPAIGN AVE | 92 |
| RICHMOND AVE | 86 |
| MARION AVE | 82 |
| MARSHALL AVE | 76 |
| WESTERN AVE | 68 |
| I57 | 66 |
| PRAIRIE AVE | 66 |
| 09TH ST | 64 |
| LAFAYETTE AVE | 56 |
| 19TH ST | 50 |
| PIATT AVE | 46 |
| 16TH ST | 44 |
| EDGAR AVE | 40 |
| OLD STATE RD | 36 |
| 15TH ST | 34 |
| PARADISE RD | 34 |
| INTERSTATE 57 | 32 |
| WABASH AVE | 32 |
| 14TH ST | 28 |
| 21ST ST | 28 |
| WOODLAWN AVE | 28 |
| 06TH ST | 26 |
| 11TH ST | 26 |
| PARK PLAZA | 26 |
2002 - 2018 National Fire Incident Reporting System (NFIRS) incidents
- Incident types reported to NFIRS in Mattoon, IL
- 12,45469.1%Rescue & EMS
- 1,7749.8%Fire
- 1,1646.5%Hazardous Condition
- 1,1556.4%Service Call
- 8694.8%False Alarm
- 5543.1%Good Intent Call
- Fire incident types reported to NFIRS in Mattoon, IL
- 78344.1%Outside Fires
- 57932.6%Structure Fires
- 31317.6%Mobile Property/Vehicle Fires
- 995.6%Other
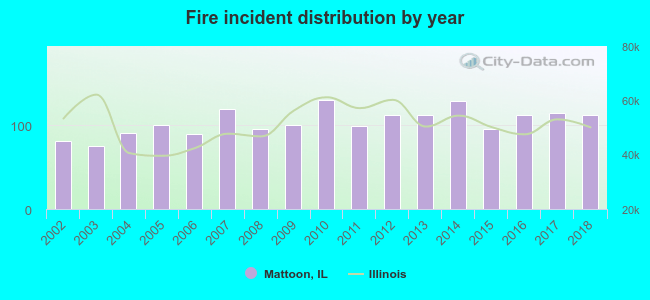 Based on the data from the years 2002 - 2018 the average number of fire incidents per year is 104. The highest number of reported fire incidents - 130 took place in 2010, and the least - 75 in 2003. The data has an increasing trend.
The average number of yearly fire incidents per 10k residents in Mattoon, IL compared to nearest cities:
(Note: Based on data for the last 3 years, including only cities with population 5,000 and above)
| Mattoon: | 62.2 |
| Charleston: | 54.2 |
| Effingham: | 83.2 |
| Paris: | 82.0 |
| Pana: | 92.5 |
| Monticello: | 35.0 |
| Decatur: | 53.1 |
 The median response time based on all reported fire incidents is 4 minutes. This is lower than the Illinois median value.
The median response time in Mattoon, IL compared to nearest cities:
(Note: Based on data for all years, including only cities with at least 500 fire incidents)
| Mattoon: | 4 minutes |
| Charleston: | 3 minutes |
| Sullivan: | 7 minutes |
| Shelbyville: | 6 minutes |
| Effingham: | 4 minutes |
| Newton: | 7 minutes |
| Marshall: | 9 minutes |
| Paris: | 6 minutes |
| Pana: | 7 minutes |
 According to the data from the years 2002 - 2018 the average number of fire-related yearly deaths is 0. The highest number of reported deaths - 1 took place in 2002, and the lowest - 0 in 2004. The data has a declining trend.
 Based on the data from the years 2002 - 2018 the average number of fire-related yearly casualties is 2. The highest number of reported injuries - 5 took place in 2005, and the lowest - 0 in 2009. The data has a declining trend.
The average number of casualties per 1,000 fire incidents is 16. This indicator was the highest - 56 in 2006, and the lowest 0 in 2009. The trend for casualties per 1,000 fire incidents is dropping. Compared to the Illinois value the number of casualties per 1,000 incidents is higher.
Based on the data from the years 2002 - 2018 the average number of fire-related yearly casualties is 2. The highest number of reported injuries - 5 took place in 2005, and the lowest - 0 in 2009. The data has a declining trend.
The average number of casualties per 1,000 fire incidents is 16. This indicator was the highest - 56 in 2006, and the lowest 0 in 2009. The trend for casualties per 1,000 fire incidents is dropping. Compared to the Illinois value the number of casualties per 1,000 incidents is higher.Casualties per 1,000 incidents in Mattoon, IL compared to nearest cities:
(Note: Based on data for all years, including only cities with at least 500 fire incidents)
| Mattoon: | 15.2 |
| Charleston: | 17.3 |
| Sullivan: | 11.1 |
| Shelbyville: | 5.9 |
| Effingham: | 10.8 |
| Newton: | 14.9 |
| Marshall: | 5.1 |
| Paris: | 20.6 |
| Pana: | 16.0 |
 31.8% incidents where reported in the morning and 68.2% in the evening. The most fires (15.1%) took place on Friday, and the least (13.5%) on Wednesday.
 According to the 1,774 reports from years 2002 - 2018 most fires (11.2%) took place during July, and the least (5.1%) in December.
 Out of all 18,014 cases reported during the years 2002 - 2018, the most belonged to the categories: Rescue & EMS (69.1%), Fire (9.8%), and Hazardous Condition (6.5%).
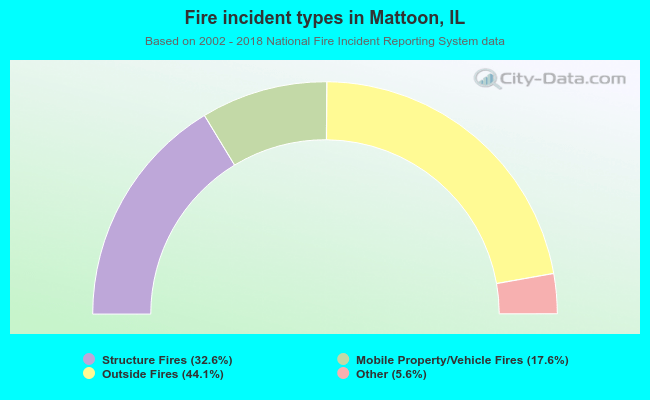 When looking into fire subcategories, the most reports belonged to: Outside Fires (44.1%), and Structure Fires (32.6%).