Shelbyville: Fire Incidents, Illinois (IL)
Where are fire incidents reported in Shelbyville, IL
Something went wrong! Please refresh the page.
|
| |||||||||||||||||||||||||||||||||||||||||||||||||||||||||||||||||||||||||||||||||||||||||||||||||||||||||||||
| Other | 146 | |||||||||||||||||||||||||||||||||||||||||||||||||||||||||||||||||||||||||||||||||||||||||||||||||||||||||||||
2003 - 2018 National Fire Incident Reporting System (NFIRS) incidents
- Incident types reported to NFIRS in Shelbyville, IL
- 67857.3%Fire
- 21418.1%Hazardous Condition
- 13611.5%Service Call
- 857.2%False Alarm
- 544.6%Good Intent Call
- 100.8%Severe Weather
- 60.5%Rescue & EMS
- Fire incident types reported to NFIRS in Shelbyville, IL
- 26639.2%Outside Fires
- 25137.0%Structure Fires
- 9814.5%Mobile Property/Vehicle Fires
- 639.3%Other
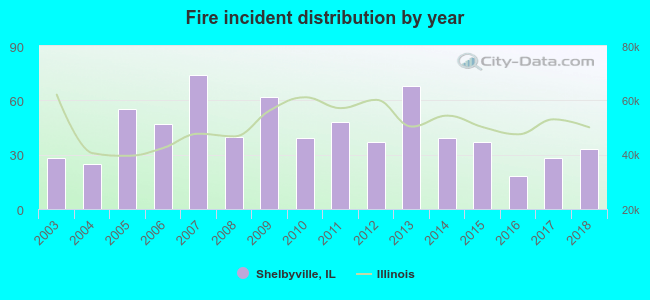 Based on the data from the years 2003 - 2018 the average number of fires per year is 42. The highest number of reported fires - 74 took place in 2007, and the least - 18 in 2016. The data has a rising trend.
 The median response time based on all reported fire incidents is 6 minutes. This is similar to the state median value.
The median response time in Shelbyville, IL compared to nearest cities:
(Note: Based on data for all years, including only cities with at least 500 fire incidents)
| Shelbyville: | 6 minutes |
| Pana: | 7 minutes |
| Sullivan: | 7 minutes |
| Mattoon: | 4 minutes |
| Effingham: | 4 minutes |
| Taylorville: | 6 minutes |
| Decatur: | 5 minutes |
| Charleston: | 3 minutes |
| Vandalia: | 8 minutes |
 34.4% incidents where reported in the morning and 65.6% in the evening. The most fires (17.8%) took place on Saturday, and the least (10.9%) on Wednesday.
 According to the 678 fire incident reports from years 2003 - 2018 most fires (12.5%) took place during March, and the least (4.7%) in January.
 Out of all 1,183 cases reported during the years 2003 - 2018, the most belonged to the categories: Fire (57.3%), Rescue & EMS (18.1%), and Hazardous Condition (11.5%).
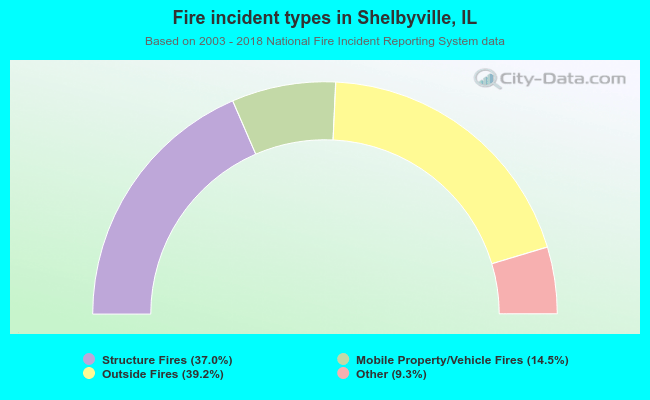 When looking into fire subcategories, the most reports belonged to: Outside Fires (39.2%), and Structure Fires (37.0%).