Emmett: Fire Incidents, Idaho (ID)
Where are fire incidents reported in Emmett, ID
Something went wrong! Please refresh the page.
|
| |||||||||||||||||||||||||||||||||||||||||||||||||||||||||||||||||||||||||||||||||||||||||||||||||||||||||||||
| Other | 276 | |||||||||||||||||||||||||||||||||||||||||||||||||||||||||||||||||||||||||||||||||||||||||||||||||||||||||||||
2002 - 2018 National Fire Incident Reporting System (NFIRS) incidents
- Incident types reported to NFIRS in Emmett, ID
- 1,64850.6%Fire
- 51715.9%Hazardous Condition
- 37111.4%Rescue & EMS
- 2838.7%Good Intent Call
- 2146.6%Service Call
- 2026.2%False Alarm
- 100.3%Overpressure Rupture
- 50.2%Severe Weather
- 50.2%Special Incident
- Fire incident types reported to NFIRS in Emmett, ID
- 95958.2%Outside Fires
- 40024.3%Structure Fires
- 16510.0%Mobile Property/Vehicle Fires
- 1247.5%Other
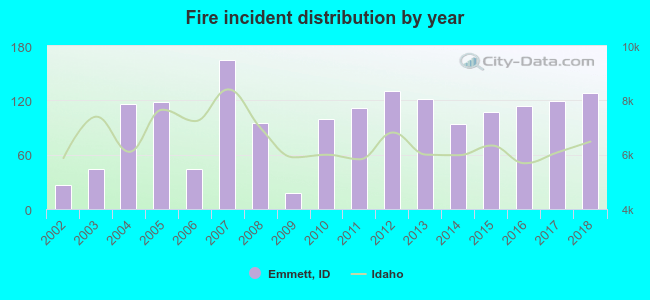 According to the data from the years 2002 - 2018 the average number of fire incidents per year is 97. The highest number of fires - 164 took place in 2007, and the least - 18 in 2009. The data has a rising trend.
The average number of yearly fire incidents per 10k residents in Emmett, ID compared to nearest cities:
(Note: Based on data for the last 3 years, including only cities with population 5,000 and above)
| Emmett: | 182.4 |
| Star: | 64.4 |
| Middleton: | 77.9 |
| Eagle: | 41.0 |
| Caldwell: | 65.6 |
| Meridian: | 25.0 |
| Garden City: | 28.3 |
| Nampa: | 29.8 |
| Boise: | 24.6 |
 The median response time based on all reported fire incidents is 7 minutes. This is similar to the state median value.
The median response time in Emmett, ID compared to nearest cities:
(Note: Based on data for all years, including only cities with at least 500 fire incidents)
| Emmett: | 7 minutes |
| Star: | 8 minutes |
| Middleton: | 10 minutes |
| Eagle: | 7 minutes |
| Caldwell: | 8 minutes |
| New Plymouth: | 10 minutes |
| Meridian: | 6 minutes |
| Garden City: | 5 minutes |
| Nampa: | 6 minutes |
 26.6% incidents where reported in the morning and 73.4% in the evening. The most fires (15.5%) took place on Friday, and the least (12.6%) on Thursday.
 According to the 1,648 fires from years 2002 - 2018 most fires (20.3%) took place during July, and the least (4.3%) in November.
 Out of all 3,255 cases reported during the years 2002 - 2018, the most belonged to the categories: Fire (50.6%), Hazardous Condition (15.9%), and Rescue & EMS (11.4%).
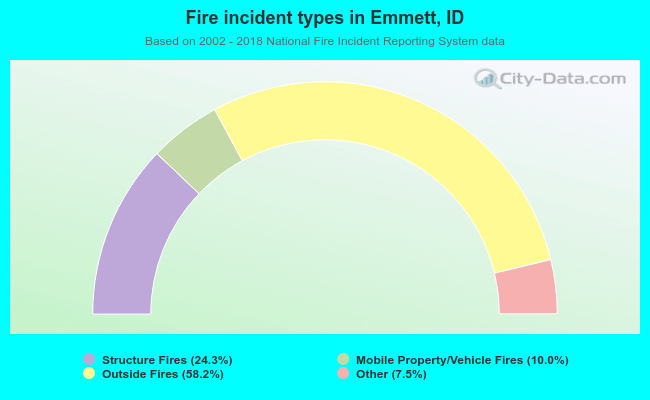 When looking into fire subcategories, the most reports belonged to: Outside Fires (58.2%), and Structure Fires (24.3%).