Caldwell: Fire Incidents, Idaho (ID)
Where are fire incidents reported in Caldwell, ID
Something went wrong! Please refresh the page.
| Fire incidents reported | |
|---|---|
| Sreet name | Count |
| CLEVELAND BLVD | 262 |
| USTICK RD | 258 |
| FARMWAY RD | 218 |
| OLD HWY 30 | 190 |
| CHICAGO ST | 148 |
| INDIANA AVE | 148 |
| LINDEN ST | 146 |
| SIMPLOT BLVD | 140 |
| HOMEDALE RD | 136 |
| KIMBALL AVE | 112 |
| MONTANA AVE | 112 |
| SAND HOLLOW RD | 112 |
| PURPLE SAGE RD | 110 |
| BLAINE ST | 106 |
| WAGNER RD | 102 |
| 10TH AVE | 100 |
| ELGIN ST | 100 |
| ILLINOIS AVE | 84 |
| LOGAN ST | 78 |
| HWY 20/26 | 74 |
| KARCHER RD | 74 |
| EMMETT RD | 72 |
| FLORIDA AVE | 72 |
| KCID RD | 70 |
| LAKE AVE | 70 |
| MAIN ST | 68 |
| ARTHUR ST | 62 |
| MIDDLETON RD | 62 |
| NOTUS RD | 62 |
| GALLOWAY RD | 60 |
| Other | 1,773 |
2002 - 2018 National Fire Incident Reporting System (NFIRS) incidents
- Incident types reported to NFIRS in Caldwell, ID
- 16,26352.2%Rescue & EMS
- 5,18116.6%Fire
- 4,24213.6%Good Intent Call
- 2,9229.4%Service Call
- 1,2744.1%Hazardous Condition
- 1,2414.0%False Alarm
- 330.1%Special Incident
- Fire incident types reported to NFIRS in Caldwell, ID
- 2,57149.6%Outside Fires
- 1,75233.8%Structure Fires
- 75414.6%Mobile Property/Vehicle Fires
- 1042.0%Other
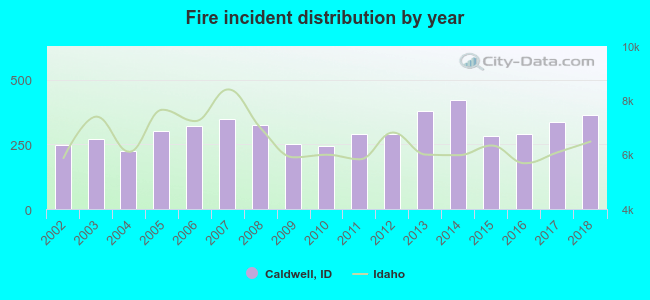 Based on the data from the years 2002 - 2018 the average number of fires per year is 305. The highest number of reported fires - 420 took place in 2014, and the least - 224 in 2004. The data has an increasing trend.
The average number of yearly fire incidents per 10k residents in Caldwell, ID compared to nearest cities:
(Note: Based on data for the last 3 years, including only cities with population 5,000 and above)
| Caldwell: | 65.6 |
| Middleton: | 77.9 |
| Nampa: | 29.8 |
| Star: | 64.4 |
| Meridian: | 25.0 |
| Eagle: | 41.0 |
| Kuna: | 53.9 |
| Emmett: | 182.4 |
| Garden City: | 28.3 |
 The median response time based on all reported fire incidents is 8 minutes. This is comparable to the state median value.
The median response time in Caldwell, ID compared to nearest cities:
(Note: Based on data for all years, including only cities with at least 500 fire incidents)
| Caldwell: | 8 minutes |
| Middleton: | 10 minutes |
| Nampa: | 6 minutes |
| Star: | 8 minutes |
| Wilder: | 8 minutes |
| Meridian: | 6 minutes |
| Parma: | 17 minutes |
| Eagle: | 7 minutes |
| Kuna: | 10 minutes |
 According to the data from the years 2002 - 2018 the average number of fire-related yearly deaths is 0. The highest number of reported deaths - 1 took place in 2003, and the lowest - 0 in 2002. The data has an increasing trend.
The average number of deaths per 1,000 fires is 1. This indicator was the highest - 4 in 2003, and the lowest 0 in 2002. The trend for fatalities per 1,000 fire incidents is increasing. Compared to the state value the number of fatalities per 1,000 fire incidents is much lower.
According to the data from the years 2002 - 2018 the average number of fire-related yearly deaths is 0. The highest number of reported deaths - 1 took place in 2003, and the lowest - 0 in 2002. The data has an increasing trend.
The average number of deaths per 1,000 fires is 1. This indicator was the highest - 4 in 2003, and the lowest 0 in 2002. The trend for fatalities per 1,000 fire incidents is increasing. Compared to the state value the number of fatalities per 1,000 fire incidents is much lower.
 According to the data from the years 2002 - 2018 the average number of fire-related casualties per year is 4. The highest number of injuries - 11 took place in 2011, and the lowest - 0 in 2006. The data has a rising trend.
The average number of casualties per 1,000 fires is 14. This indicator was the highest - 38 in 2011, and the lowest 0 in 2006. The trend for injuries per 1,000 fires is rising. Compared to the Idaho value the number of injuries per 1,000 fire incidents is higher.
According to the data from the years 2002 - 2018 the average number of fire-related casualties per year is 4. The highest number of injuries - 11 took place in 2011, and the lowest - 0 in 2006. The data has a rising trend.
The average number of casualties per 1,000 fires is 14. This indicator was the highest - 38 in 2011, and the lowest 0 in 2006. The trend for injuries per 1,000 fires is rising. Compared to the Idaho value the number of injuries per 1,000 fire incidents is higher.
 29.9% incidents where reported in the morning and 70.1% in the evening. The most fires (16.1%) took place on Monday, and the least (12.6%) on Thursday.
 According to the 5,181 fire incident reports from years 2002 - 2018 most fires (16.3%) took place during July, and the least (4.9%) in January.
 Out of all 31,176 cases reported during the years 2002 - 2018, the most belonged to the categories: Rescue & EMS (52.2%), Fire (16.6%), and Good Intent Call (13.6%).
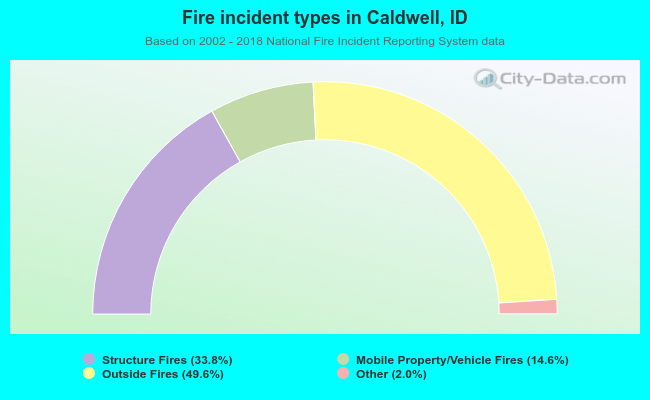 When looking into fire subcategories, the most incidents belonged to: Outside Fires (49.6%), and Structure Fires (33.8%).